Leave a Message

Thank you for your message. We will be in touch with you shortly.

Explore Our Properties

Sherman Oaks

main

Representation

Document Package

Service Agreement. 

We Will Run a Custom Search or Marketing Plan for Your specific needs.

Demographics and Employment Data for Sherman Oaks, CA

Sherman Oaks has 27,367 households, with an average household size of 4.24. Data provided by the U.S. Census Bureau. Here’s what the people living in Sherman Oaks do for work — and how long it takes them to get there. Data provided by the U.S. Census Bureau. 58,102 people call Sherman Oaks home. The population density is 7,621.251 and the largest age group is Data provided by the U.S. Census Bureau.

58,102

Total Population

High

Population Density Population Density This is the number of people per square mile in a neighborhood.

40.667994217066536

Median Age

50.36 / 49.64%

Men vs Women

Population by Age Group

0-9:

0-9 Years

10-17:

10-17 Years

18-24:

18-24 Years

25-64:

25-64 Years

65-74:

65-74 Years

75+:

75+ Years

Education Level

  • Less Than 9th Grade
  • High School Degree
  • Associate Degree
  • Bachelor Degree
  • Graduate Degree
27,367

Total Households

4.24

Average Household Size

$84,032.463

Average individual Income

Households with Children

With Children:

Without Children:

Marital Status

Married
Single
Divorced
Separated

Blue vs White Collar Workers

Blue Collar:

White Collar:

Commute Time

0 to 14 Minutes
15 to 29 Minutes
30 to 59 Minutes
60+ Minutes

Sherman Oaks: 3-Year Market Projection

2026

  • Active Listings: Expected around 770–800, reflecting stable but elevated supply.
  • Closed Sales: Likely 320–340, consistent with 2025’s softer absorption.
  • Median Prices: Flat-to-modest appreciation, list ~$1.95M–$2.0M, sold ~$1.9M–$1.95M.
  • $/Sq.Ft.: ~$830–$860, holding steady.
  • Key Factor: Mortgage rates remain “higher for longer,” keeping turnover slow, though Sherman Oaks’ family-friendly appeal and central Valley location provide stability.

2027

  • Active Listings: Expected to dip to 740–760, as discretionary sellers withdraw.
  • Closed Sales: Modest rebound to 350–370, signaling improved absorption.
  • Median Prices: Gradual growth, list ~$2.0M–$2.05M, sold ~$1.95M–$2.0M.
  • $/Sq.Ft.: ~$860–$890, edging higher with demand for renovated homes.
  • Key Factor: Economic stabilization and improved financing conditions increase buyer activity, particularly in entry-level luxury homes.

2028

  • Active Listings: Balanced at 720–740, aligning with long-term averages.
  • Closed Sales: Strengthening to 380–400, approaching mid-2010s levels.
  • Median Prices: Renewed appreciation, list ~$2.05M–$2.1M, sold ~$2.0M–$2.05M.
  • $/Sq.Ft.: ~$900–$940, potentially testing record highs in prime Sherman Oaks neighborhoods.
  • Key Factor: Strong demand from move-up buyers and continued inflows from Westside buyers seeking value sustain growth.

Summary Projection

  • Short-term (2026): Stabilization with steady prices but muted sales activity.
  • Mid-term (2027): Gradual rebound, with stronger absorption and modest appreciation.
  • Long-term (2028): Market rebalances, with healthier turnover and renewed upward pricing pressure.

Bottom Line: Sherman Oaks is moving from a post-peak correction (2023–2025) into a stabilization and recovery phase (2026–2028). While turnover may remain below peak years, values are expected to continue appreciating modestly, anchored by strong demand for central Valley living and limited developable supply.


Download Sherman Oaks Data


 Analysis of Sherman Oaks (2013–2025)


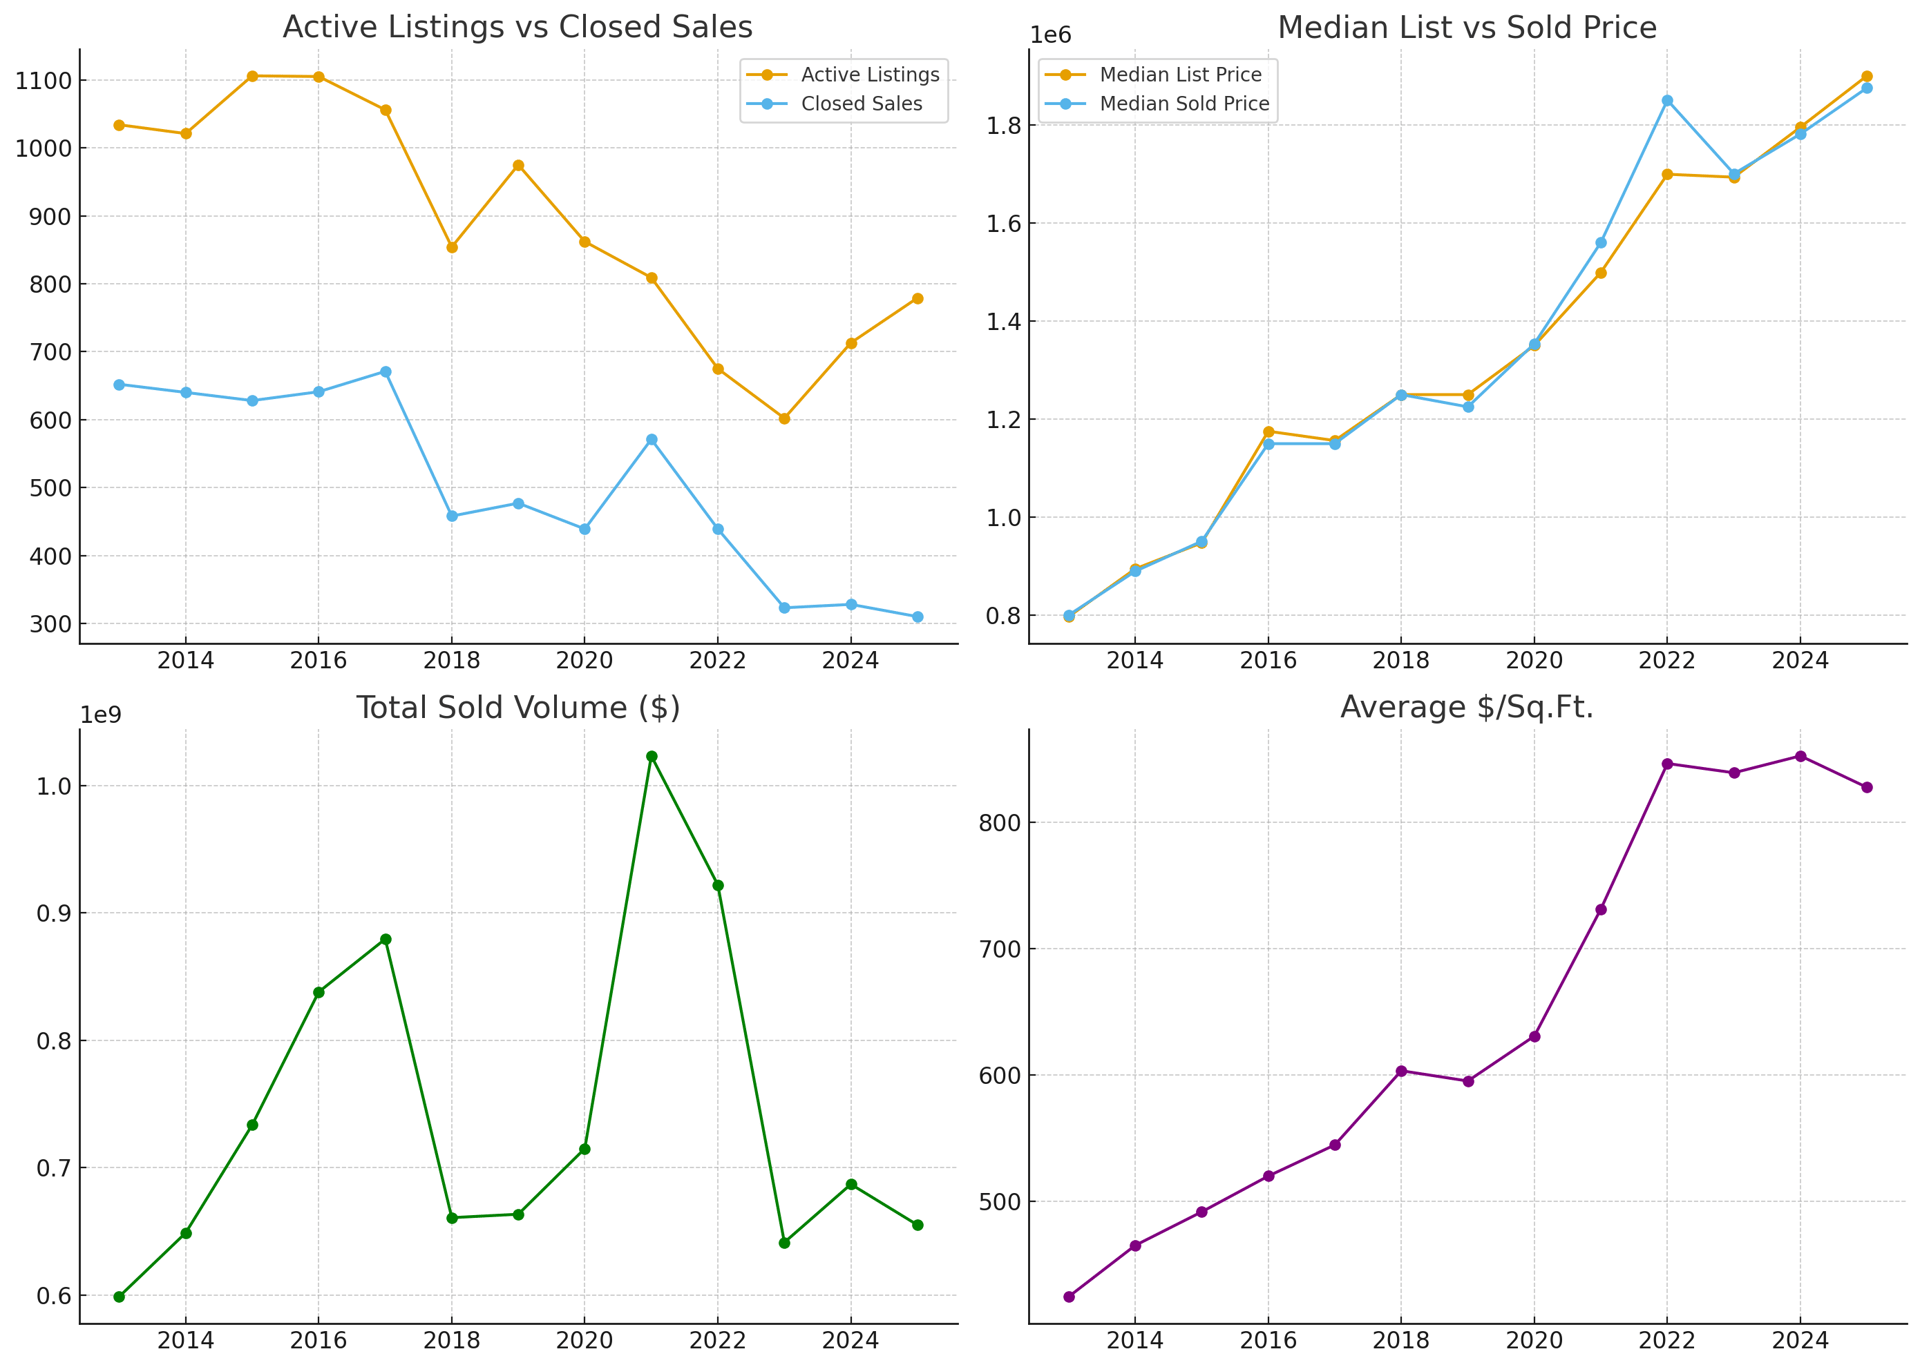
1. Market Activity: Active Listings & Closed Sales

  • 2013–2017: Active listings held steady between ~1,020–1,110, with closed sales ranging 628–671. Closure rates averaged around 56–63%, reflecting a balanced mid-market segment.
  • 2018–2020: Sales slowed, with closure rates dipping to the 46–53% range, despite stable inventory.
  • 2021–2022: Peak activity, with closure rates climbing to 71% (2021) and 65% (2022), coinciding with the COVID-era housing boom.
  • 2025: Closings dropped to 310, only 40% of listings, indicating a significant slowdown in demand relative to supply.

2. Closure Rate (Absorption)

  • 2013–2017: Healthy absorption around 56–63%, showing consistent demand.
  • 2018–2020: Fell into the 46–53% zone, highlighting slower turnover and longer marketing times.
  • 2021–2022: Surged to 70–65%, the strongest absorption in over a decade.
  • 2023–2025: Retreated to 40–54%, underscoring weakening buyer urgency and reduced liquidity.

3. Pricing Trends: Median List vs. Median Sold

  • 2013–2017: Median List rose from $798K to $1.15M, while Sold mirrored closely, ending at $1.15M, showing tight alignment.
  • 2018–2020: Continued appreciation; by 2020, list prices reached $1.35M and sales $1.35M, maintaining balance.
  • 2021–2022: Sharp jump — median sold hit $1.56M in 2021 and $1.85M in 2022, outpacing list values.
  • 2023–2025: Prices stabilized around $1.7M–$1.9M, but with softer absorption, suggesting buyers are more selective.

4. Total Sold Volume

  • 2013–2017: Annual sales ranged from $598M–$879M, showing steady turnover.
  • 2018–2020: Stable in the $660M–$715M band.
  • 2021: Record high of $1.02B, a watershed year for Sherman Oaks.
  • 2022: Stayed strong at $922M, despite fewer listings.
  • 2025: Dropped back to $655M, a 36% decline from peak, showing reduced transaction flow.

5. Value Per Square Foot

  • 2013: Averaged $425/Sq.Ft.
  • 2017: Rose to $545/Sq.Ft.
  • 2021–2022: Surged to $731–$846/Sq.Ft., reflecting bidding wars.
  • 2025: Corrected to $827/Sq.Ft., still nearly double 2013 levels, showing underlying price resilience.

6. Sale-to-List Ratios

  • 2013–2017: Strong, holding 98.4%–99.4%, showing minimal negotiation gaps.
  • 2021–2022: Exceptional — peaked at 103.6% in 2022, as homes sold over asking.
  • 2025: Fell to 97.9%, reflecting greater buyer leverage and negotiation room.

What This Means

  • 2013–2017: A stable, healthy period with consistent liquidity and steady appreciation.
  • 2018–2020: Softer absorption, though prices continued rising.
  • 2021–2022: A historic boom — record-high volumes, rapid absorption, and homes selling over list.
  • 2023–2025: A clear correction — fewer closings, lower absorption, and more price flexibility, though values remain high compared to a decade ago.

Bottom Line
Sherman Oaks remains a resilient Valley submarket. Even as transaction volume has slowed post-2022, home values are still nearly double 2013 levels. Looking forward, expect modest price stabilization with slower turnover, as the market recalibrates from its record-setting highs.


Search Homes

Around Sherman Oaks, CA

There's plenty to do around Sherman Oaks, including shopping, dining, nightlife, parks, and more. Data provided by Walk Score and Yelp.

79
Very Walkable
Walking Score
50
Bikeable
Bike Score
54
Good Transit
Transit Score

Points of Interest

Explore popular things to do in the area, including Kenkodo, Devilash, and Koyano Skincare.

Name Category Distance Reviews
Ratings by Yelp
Active 4.24 miles 5 reviews 5/5 stars
Beauty 4.58 miles 12 reviews 5/5 stars
Beauty 0.49 miles 7 reviews 5/5 stars
Beauty 4.07 miles 5 reviews 5/5 stars

Schools in Sherman Oaks, CA

All ()
Primary Schools ()
Middle Schools ()
High Schools ()
Mixed Schools ()
The following schools are within or nearby Sherman Oaks. The rating and statistics can serve as a starting point to make baseline comparisons on the right schools for your family. Data provided by the U.S. Census Bureau.
Type
Name
Category
Grades
School rating

Work With Us

Bringing together a team with the passion, dedication, and resources to help our clients reach their buying and selling goals. With you every step of the way.

Follow Me on Instagram