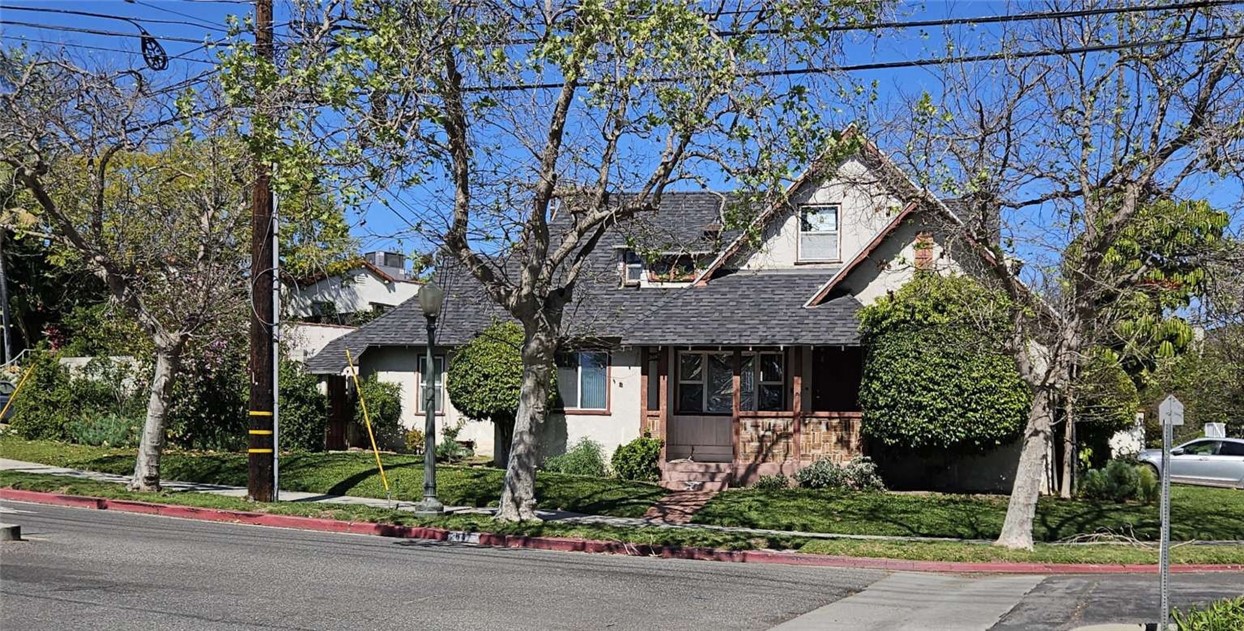
Leave a Message

Thank you for your message. We will be in touch with you shortly.

Explore Our Properties

Cheviot Hills Rancho Park

main

Representation

Document Package

Service Agreement. 

We Will Run a Custom Search or Marketing Plan for Your specific needs.

Demographics and Employment Data for Cheviot Hills Rancho Park, CA

Cheviot Hills Rancho Park has 2,804 households, with an average household size of 3. Data provided by the U.S. Census Bureau. Here’s what the people living in Cheviot Hills Rancho Park do for work — and how long it takes them to get there. Data provided by the U.S. Census Bureau. 7,298 people call Cheviot Hills Rancho Park home. The population density is 7,315.147 and the largest age group is Data provided by the U.S. Census Bureau.

7,298

Total Population

High

Population Density Population Density This is the number of people per square mile in a neighborhood.

48

Median Age

50.42 / 49.56%

Men vs Women

Population by Age Group

0-9:

0-9 Years

10-17:

10-17 Years

18-24:

18-24 Years

25-64:

25-64 Years

65-74:

65-74 Years

75+:

75+ Years

Education Level

  • Less Than 9th Grade
  • High School Degree
  • Associate Degree
  • Bachelor Degree
  • Graduate Degree
2,804

Total Households

3

Average Household Size

$117,067

Average individual Income

Households with Children

With Children:

Without Children:

Marital Status

Married
Single
Divorced
Separated

Blue vs White Collar Workers

Blue Collar:

White Collar:

Commute Time

0 to 14 Minutes
15 to 29 Minutes
30 to 59 Minutes
60+ Minutes

Encino: 3-Year Market Projection

2026

  • Active Listings: Expected to hover around 680–700, reflecting a continuation of elevated inventory as more owners test the market.
  • Closed Sales: Likely ~230–240, consistent with 2025 levels, showing limited absorption due to financing headwinds.
  • Median Prices: Stabilization phase. List ~$2.6M–$2.7M, sold ~$2.2M–$2.3M.
  • $/Sq.Ft.: Holds near ~$800–$820, with modest upward pressure from remodeled homes.
  • Key Factor: Mortgage rates staying “higher for longer” keeps sales volume restrained, but cash-rich luxury buyers continue to prop up values.

2027

  • Active Listings: Inventory begins moderating to 650–670, as discouraged sellers exit and only serious listings remain.
  • Closed Sales: Modest recovery toward 250–260, reflecting improving absorption.
  • Median Prices: Modest appreciation resumes. List ~$2.8M–$2.9M, sold ~$2.4M–$2.5M.
  • $/Sq.Ft.: Pushes upward toward ~$850–$880 as turnkey and newer builds outperform.
  • Key Factor: National inflation cooling and a stable equity market bring more confidence to buyers, leading to firmer contract activity.

2028

  • Active Listings: Balances closer to 620–640, a healthier market level.
  • Closed Sales: Climbs toward 270–280, approaching the stronger cycles seen pre-2019.
  • Median Prices: Renewed upward momentum. List ~$3.0M–$3.1M, sold ~$2.6M–$2.7M.
  • $/Sq.Ft.: Could test ~$900–$950, reflecting Encino’s continued repositioning as a core luxury market.
  • Key Factor: With rates likely easing and global demand for LA luxury steady, Encino benefits from its larger homes and competitive value compared to Beverly Hills and Bel Air.

Summary Projection

  • Short-term (2026): Stabilization with restrained closings but firm pricing.
  • Mid-term (2027): Sales rebound modestly as economic clarity builds and financing stabilizes.
  • Long-term (2028): Healthy appreciation resumes, with Encino regaining momentum and solidifying its status as a high-demand, lower-cost alternative to Westside luxury hubs.

Bottom Line: Encino is transitioning from its post-boom correction (2022–2025) into a gradual recovery (2026–2028). While transaction counts remain thinner than during the 2020–2021 surge, the neighborhood’s larger lot sizes, modern new builds, and relative affordability will sustain long-term appreciation.


Download Cheviot Hills Rancho Park Data


Encino Market Analysis: 2013–2025

2013–2015: Early Growth Phase

  • Sales Volume & Pricing: In 2013, total sold volume was about $468M, with median sold prices around $870K. By 2015, sales volume had surged to $636M, and the median sold price rose to $1.15M, reflecting strong upward momentum.
  • Closings: Closed sales steadily increased from 446 (2013) to 472 (2015).
  • $/Sq.Ft.: Jumped from $394 (2013) to $461 (2015), a 17% gain in just two years.
  • Trend: Encino was becoming more attractive to mid-to-upper tier buyers, with demand outpacing supply and driving consistent appreciation.

2016–2017: Peak Transaction Years

  • Closings & Volume: 2016 and 2017 were high-water marks, with 477 and 483 closed sales, and volumes topping $716M and $823M, respectively.
  • Pricing: Median sold prices climbed from $1.28M (2016) to $1.3M (2017).
  • $/Sq.Ft.: Crossed into the $500s, reaching $517/Sq.Ft. in 2017.
  • Market Dynamics: Despite heavy inventory (853–883 active listings), absorption remained strong, signaling peak demand prior to the 2020s.

2018–2019: Softening & Mixed Signals

  • Closures & Volume: 2019 saw a drop to 338 closed sales, with total volume dipping to $628M, down from $823M in 2017.
  • Median Pricing: Median sold slipped to $1.43M (2019) from the prior high of ~$1.65M in 2018.
  • $/Sq.Ft.: Stabilized around $567, slightly softer compared to prior growth.
  • Takeaway: Buyer caution emerged, reflecting affordability ceilings and early macroeconomic uncertainty.

2020–2021: Pandemic Boom

  • Closures & Volume: Closings rebounded—327 (2020) to 397 (2021). Total sales volume exploded to $915M in 2021, the cycle’s peak.
  • Pricing: Median sold prices soared to $1.85M (2021), nearly double 2013 levels.
  • $/Sq.Ft.: Jumped to $688, confirming luxury absorption and historically low mortgage rates fueling bidding wars.
  • Trend: 2021 was Encino’s “pandemic surge year,” with record-breaking prices and velocity.

2022–2025: Correction & Stabilization

  • Closures & Volume: Closings dropped to 307 in 2022, then further down to 230 in 2025. Volume also contracted sharply from $823M (2022) to $610M (2025).
  • Pricing: Median sold prices dipped slightly post-2021, from $2.2M (2022) to $2.13M (2025).
  • $/Sq.Ft.: However, average $/Sq.Ft. kept climbing, peaking at $794 in 2025—showing fewer but higher-quality trades.
  • Market Dynamics: Closure rates fell into the 33–40% range (2023–2025), highlighting buyer hesitancy, longer decision cycles, and higher interest rates. Still, pricing resilience suggests luxury demand held firm for top properties even as volume slowed.

Summary 2013–2025

  • Growth: Encino evolved from a $870K median market in 2013 to a $2.1M+ median by 2025, with $/Sq.Ft. doubling from $394 → $794.
  • Cycles:
    • 2013–2017: Expansion and rising absorption.
    • 2018–2019: Softening period with slower closings.
    • 2020–2021: Pandemic boom with record prices.
    • 2022–2025: Post-boom correction, fewer transactions, but pricing stability due to low inventory of desirable homes.
  • Key Insight: Encino has transitioned into a true luxury submarket with global and domestic demand supporting long-term values, even as volume contracts under higher rate environments.


Search Homes

Around Cheviot Hills Rancho Park, CA

There's plenty to do around Cheviot Hills Rancho Park, including shopping, dining, nightlife, parks, and more. Data provided by Walk Score and Yelp.

24
Car-Dependent
Walking Score
29
Somewhat Bikeable
Bike Score
42
Some Transit
Transit Score

Points of Interest

Explore popular things to do in the area, including Fitfean, Bravo Dancing Ballroom Academy, and Maryann Baker, DC - Baker Chiropractic.

Name Category Distance Reviews
Ratings by Yelp
Active 3.29 miles 9 reviews 5/5 stars
Active 2.2 miles 26 reviews 5/5 stars
Active 2.37 miles 8 reviews 5/5 stars
Active 4.07 miles 17 reviews 5/5 stars
Active 0.78 miles 5 reviews 5/5 stars
Active 3.98 miles 6 reviews 5/5 stars

Schools in Cheviot Hills Rancho Park, CA

All ()
Primary Schools ()
Middle Schools ()
High Schools ()
Mixed Schools ()
The following schools are within or nearby Cheviot Hills Rancho Park. The rating and statistics can serve as a starting point to make baseline comparisons on the right schools for your family. Data provided by the U.S. Census Bureau.
Type
Name
Category
Grades
School rating

Work With Us

Bringing together a team with the passion, dedication, and resources to help our clients reach their buying and selling goals. With you every step of the way.

Follow Me on Instagram