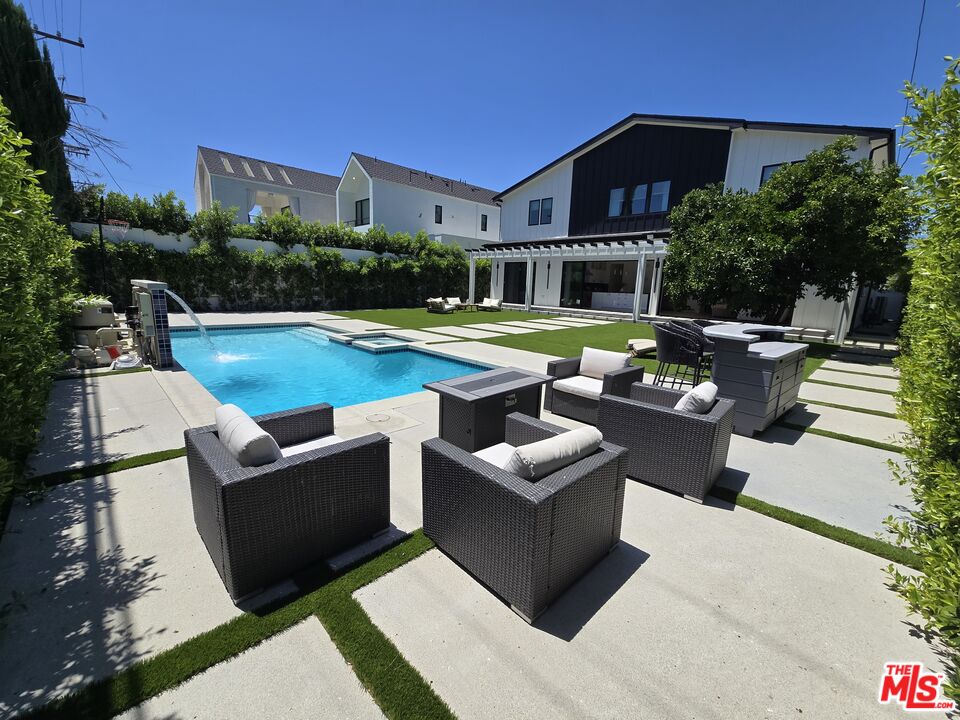
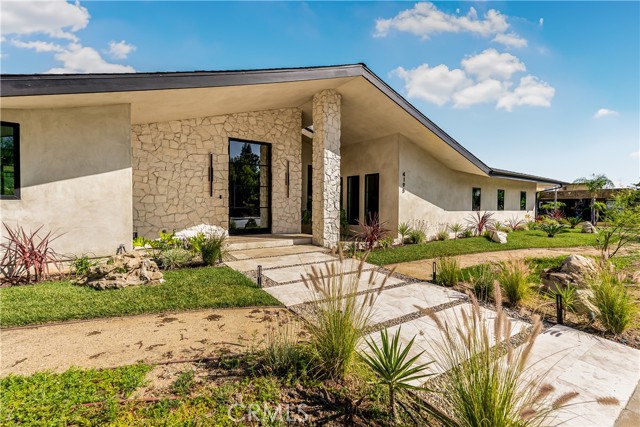
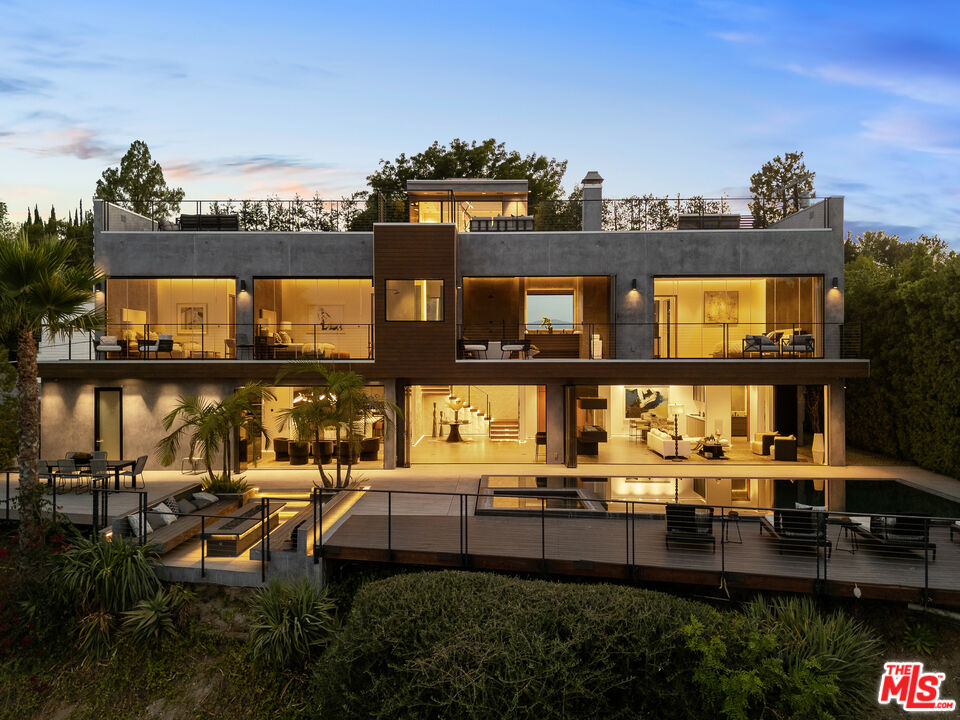
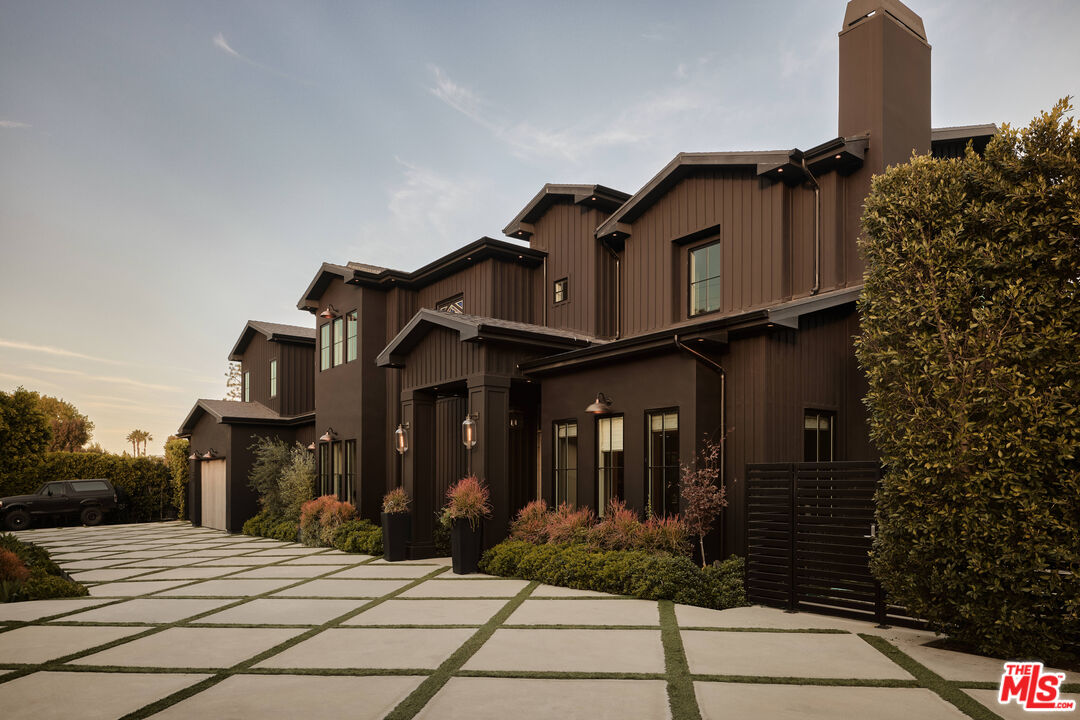
Encino Projection (2026–2028)
1. Active Listings & Closed Sales
- Active Listings: Expected to remain elevated (650–700 range), as more inventory enters the market due to recent construction and turnover.
- Closed Sales: Likely to stabilize near 220–240 annually, continuing the weaker absorption trend unless buyer demand re-accelerates.
2. Closure Rate (Absorption)
- 2026: ~32%
- 2027: ~31%
- 2028: ~30%
This suggests only 3 out of 10 listings will close, reflecting a more selective, buyer-driven environment.
3. Pricing Trends
- Median List Price: Expected to float between $2.6M–$2.8M, reflecting cautious optimism.
- Median Sold Price: Should hold closer to $2.1M–$2.3M, keeping a 10–15% negotiation gap intact.
- Price growth will likely plateau, with appreciation slowing to 2–3% annually after the pandemic boom.
4. Total Sold Volume
- Projected to hover between $600M–$650M per year, meaning Encino will remain a mid-tier volume leader in the Valley, but below its 2021 record of $916M.
5. Value Per Square Foot
- 2026: ~$800/Sq.Ft.
- 2027: ~$815/Sq.Ft.
- 2028: ~$830/Sq.Ft.
This implies gradual gains, with prices consolidating after the sharp appreciation in 2021–2022.
6. Sale-to-List Ratios
- Expected to remain in the 96–97% range, confirming buyers will continue negotiating modest discounts in most transactions.
Outlook Summary
Encino’s market is projected to hold steady but not surge:
- Inventory will remain high.
- Closure rates will soften further.
- Prices will stay historically elevated, with gentle appreciation.
- Volume will be stable but far off from pandemic-era peaks.
Encino’s advantage: its mix of larger lots, high-end new builds, and family-friendly appeal ensures continued demand. However, the market is transitioning into a slower, more sustainable phase, where buyers exercise more leverage.
Download Encino Data
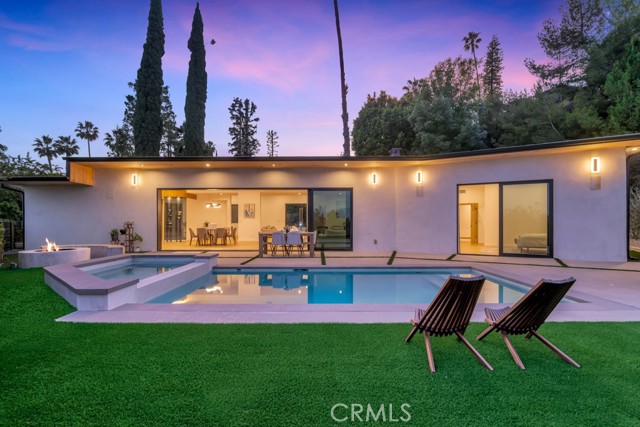
Market Analysis (2013–2025)
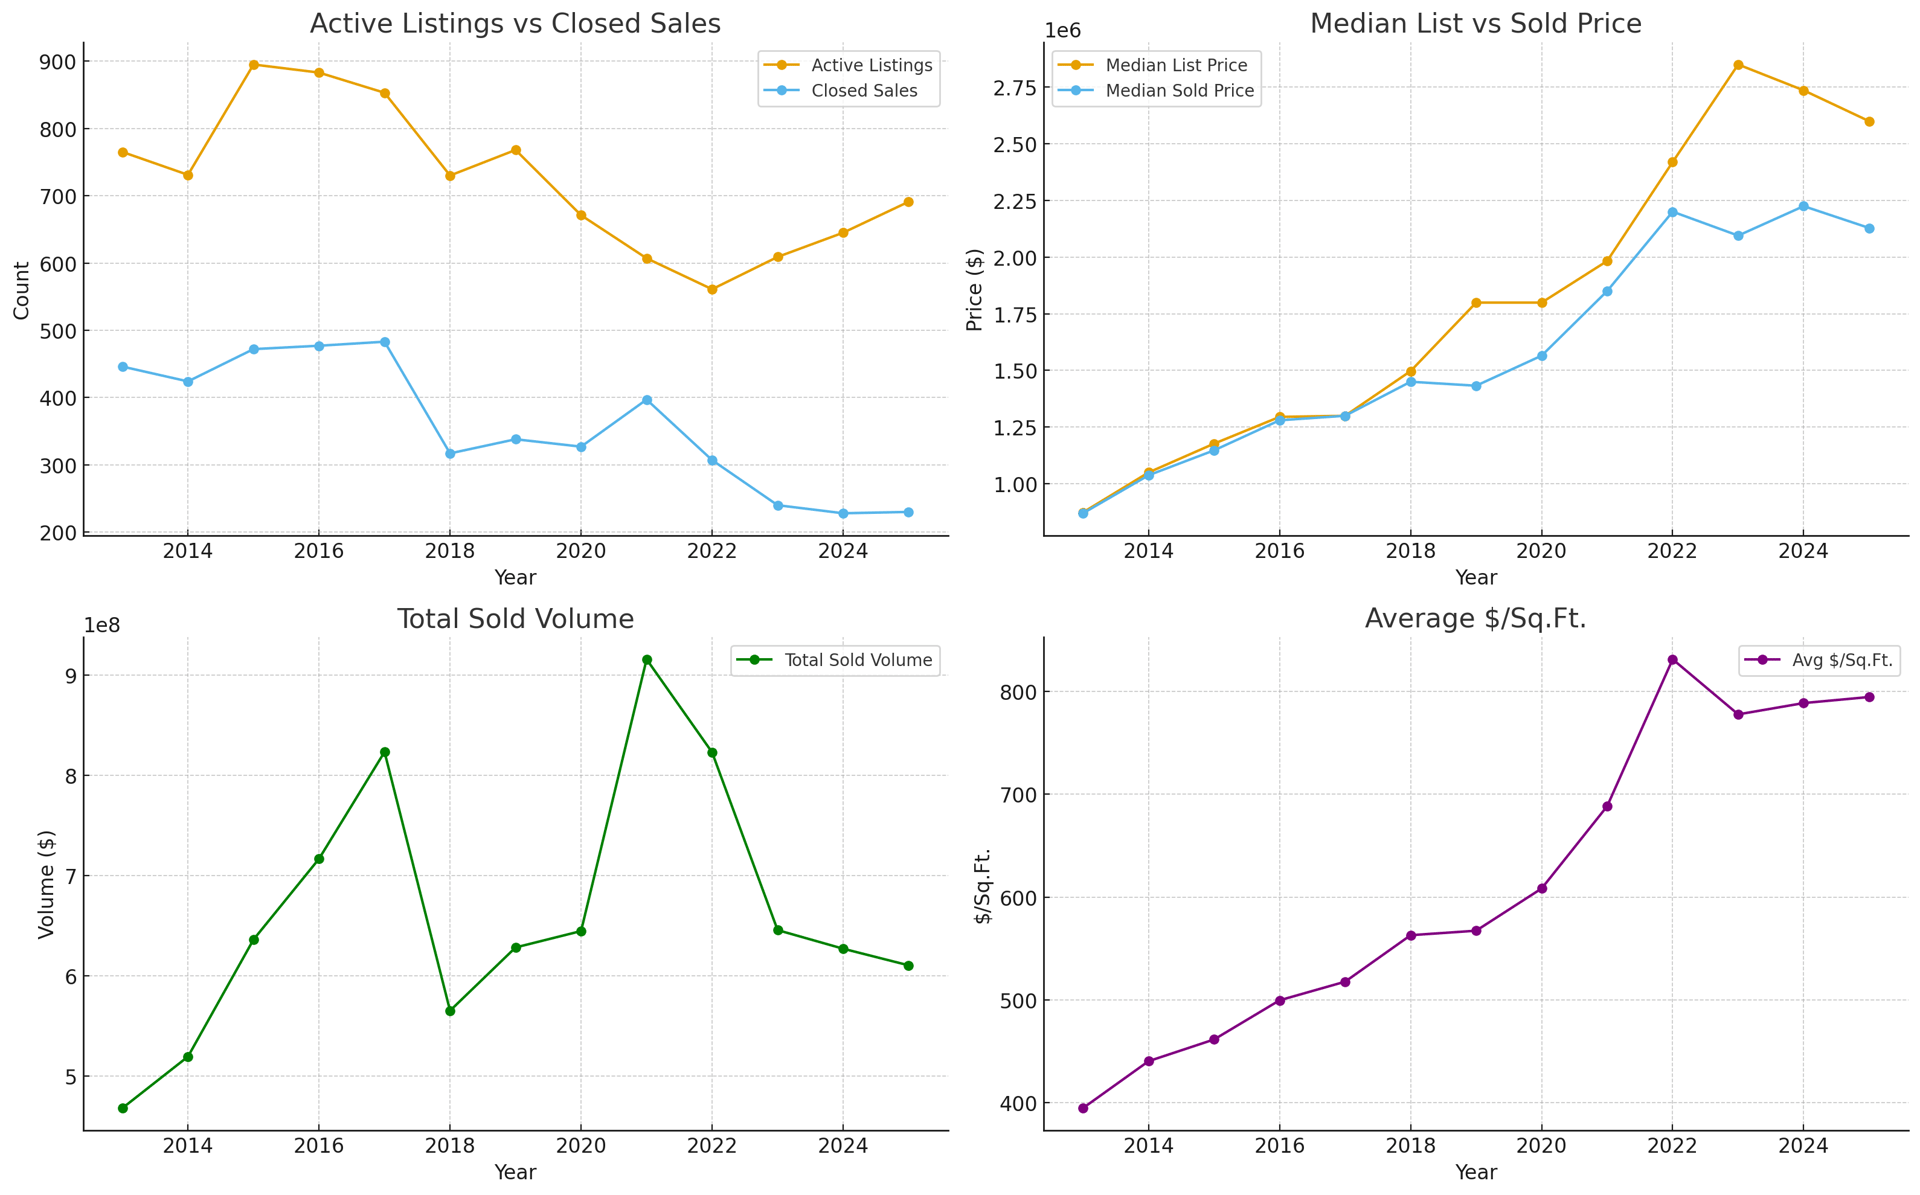
1. Market Activity: Active Listings & Closed Sales
- Active Listings ranged between 607–895 from 2013–2017, peaking in 2015 with 895 listings.
- After 2020, inventory began to decline but rebounded to 691 listings in 2025, showing a market with sustained availability.
- Closed Sales were strongest in 2017 (483) and 2021 (397), aligning with broader LA demand surges.
- By 2025, sales stabilized at 230, roughly half the levels of the 2013–2017 cycle.
2. Closure Rate (Absorption)
- 2013–2017: Closure rates were relatively healthy, ranging 52.7%–58.3%.
- 2018–2020: Absorption softened to the low-40% range, reflecting slower turnover in the luxury segment.
- 2021–2022: The market peaked with absorption reaching 65.4% in 2021 and 54.7% in 2022.
- 2023–2025: Declined again, reaching 33.3% in 2025, showing that just 1 in 3 listings converted into sales.
3. Pricing Trends: Median List vs. Median Sold
- 2013: Median List Price was $874K, while Median Sold Price was nearly equal at $870K.
- 2021–2022: Prices surged — median sold hit $1.85M (2021) and peaked at $2.2M (2022).
- 2023–2025: Prices softened, median sold dropping to $2.13M in 2025, though still more than 2x 2013 levels.
- Consistently, Encino has shown tight alignment between list and sold prices, indicating sellers are generally realistic.
4. Total Sold Volume
- 2013–2017: Total volume climbed steadily from $467M (2013) to over $823M (2017).
- 2021: Record high with $916M, driven by peak sales activity and pricing.
- 2022: Still robust at $823M, despite fewer closings.
- 2023–2025: Volume slid back to $610M (2025), down nearly 33% from 2021’s peak, signaling cooling demand.
5. Value Per Square Foot
- 2013: Averaged $395/Sq.Ft.
- 2017: Rose to $518/Sq.Ft., keeping pace with steady demand.
- 2021: Spiked to $688/Sq.Ft., then reached a high of $831/Sq.Ft. in 2022.
- 2025: Corrected to $795/Sq.Ft., still double 2013 levels, showing strong long-term appreciation.
6. Sale-to-List Ratios
- 2013–2017: Mostly strong, staying around 97%–99%.
- 2021–2022: Exceptional — ratio peaked above 100%, signaling bidding wars where buyers paid above asking.
- 2023–2025: Ratios slipped to 96%–97%, showing more buyer leverage and negotiation space.
What This Means
- 2013–2017: Healthy, balanced market with steady appreciation.
- 2018–2020: Absorption weakened, though values continued climbing.
- 2021–2022: A historic boom, with peak sales volume, record-high prices, and bidding wars.
- 2023–2025: Cooling trend — sales slowed, closure rates weakened, and volumes shrank, but price per Sq.Ft. remains historically high, indicating resilience.
Bottom Line
Encino remains one of the strongest luxury residential submarkets in the Valley, supported by larger lot sizes, newer construction, and family demand. Despite the post-2022 slowdown, prices remain firm. Over the next cycle, expect stable-to-moderate price growth but fewer sales transactions, as buyers and sellers recalibrate from the pandemic-driven highs.