62,551 people live in Hollywood Hills East, where the median age is 38 and the average individual income is $32,678. Data provided by the U.S. Census Bureau.
Total Population
Median Age
Population Density Population Density This is the number of people per square mile in a neighborhood.
Average individual Income
2026
• Active Listings: Expected to hover around 290–310, reflecting continued turnover but no major inventory surge.
• Closed Sales: Likely around 90–100, stabilizing after 2025’s slowdown.
• Median Prices: Modest stability, list ~$1.82M–$1.85M, sold ~$1.80M–$1.83M.
• $/Sq.Ft.: ~$900–$920, slightly softer as buyers remain cautious.
• Key Factor: Elevated mortgage rates and economic uncertainty keep volume muted, but sellers resist deep discounts.
2027
• Active Listings: Expected to ease to 275–290, as only serious sellers stay on market.
• Closed Sales: Gradual rebound to 105–115, reflecting improved buyer absorption.
• Median Prices: Renewed traction, list ~$1.85M–$1.90M, sold ~$1.83M–$1.87M.
• $/Sq.Ft.: ~$925–$950, showing gentle appreciation as confidence returns.
• Key Factor: A shift in Federal Reserve policy or easing inflation may lower borrowing costs, reactivating demand.
2028
• Active Listings: Balanced around 265–280, aligning closer to mid-2010s levels.
• Closed Sales: Rebound to 120–130, approaching healthier turnover rates.
• Median Prices: Continued appreciation, list ~$1.90M–$1.95M, sold ~$1.87M–$1.92M.
• $/Sq.Ft.: ~$960–$990, approaching 2023’s peak values in a more sustainable manner.
• Key Factor: Global wealth inflows and Los Angeles’ enduring luxury appeal support long-term price resilience, despite slower transaction velocity.
Summary Projection
• Short-term (2026): Stabilization, with volumes near 2025 but no major price erosion.
• Mid-term (2027): Recovery phase begins, with stronger absorption and modest price gains.
• Long-term (2028): Market rebalances, sales activity normalizes, and $/Sq.Ft. values regain peak territory.
Bottom Line: Hollywood Hills East is emerging from its post-pandemic correction. While turnover remains slow in the near term, limited supply and luxury demand set the stage for renewed stability and moderate appreciation through 2028.
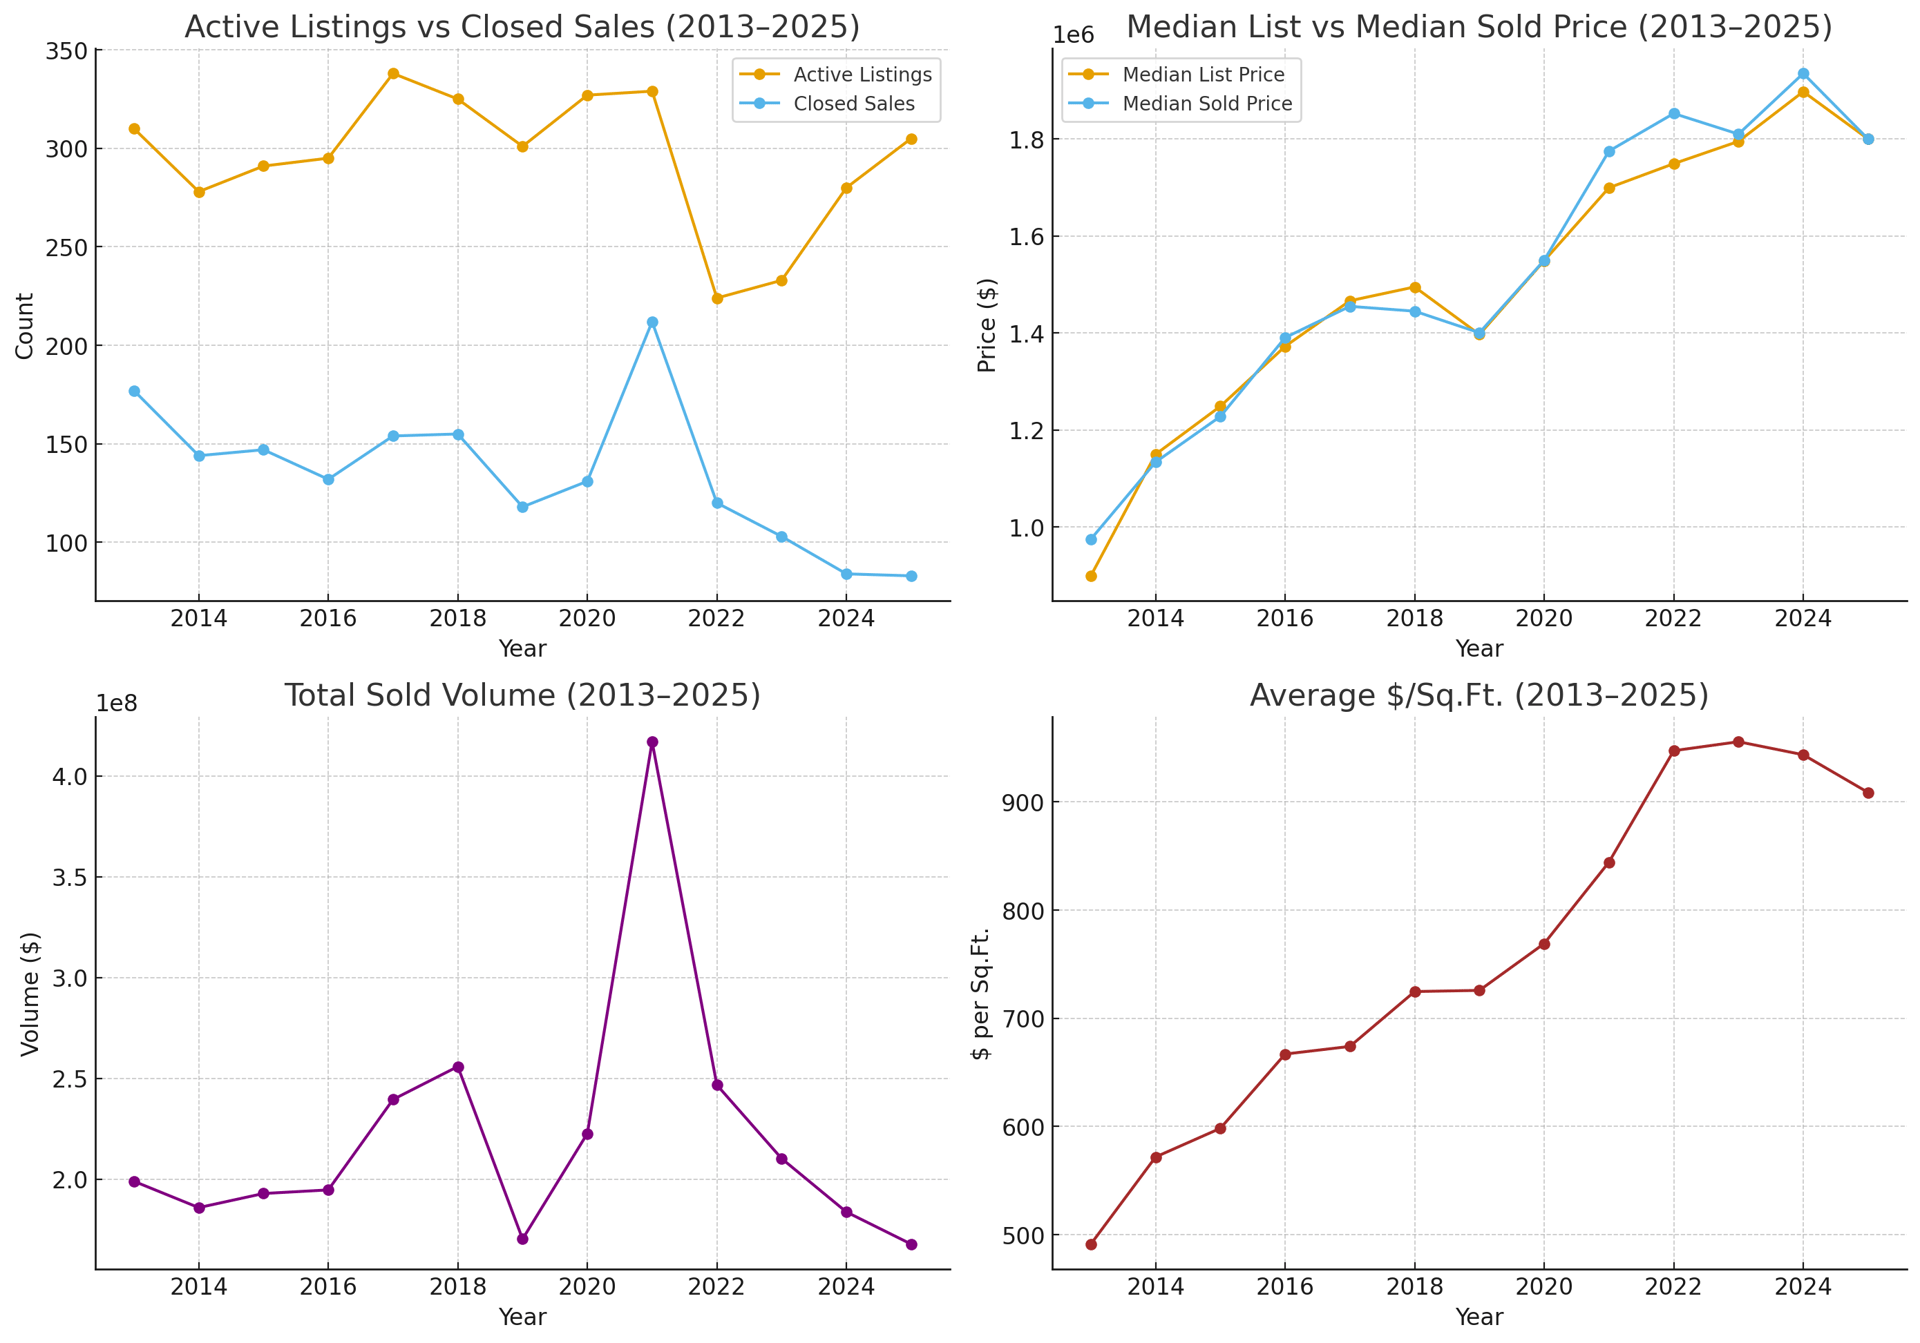
1. Market Activity: Active Listings & Closed Sales
• Active Listings generally ranged between 278 and 338 during the mid-2010s, peaking in 2017 (338 listings).
• Closed Sales peaked in 2021 (212 transactions), fueled by record-low interest rates and pandemic-driven demand.
• By 2025, only 83 sales closed, down nearly 61% from 2021, highlighting severe buyer pullback and slower absorption.
2. Closure Rate (Absorption)
• 2013–2017 maintained 44–57% closure rates, showing steady demand relative to inventory.
• The market surged in 2021 (64.4%), its strongest absorption rate in over a decade.
• By 2025, closure rate fell to just 27.2%, one of the weakest points in the timeline, reflecting a buyer’s market where many homes linger unsold.
3. Pricing Trends: Median List vs. Median Sold
• Median List Price increased from $899K in 2013 to a peak of $1.90M in 2024 before flattening to $1.80M in 2025.
• Median Sold Price mirrored this trend, climbing from $975K in 2013 to $1.94M in 2024, then slipping slightly to $1.80M in 2025.
• Market phases:
4. Total Sold Volume
• Total sales volume peaked in 2021 at $417M, benefiting from both elevated prices and high transaction counts.
• By 2025, volume fell to $168M, down nearly 60% from peak, as sales activity slowed sharply despite elevated pricing.
• Compared to early years (~$190M in 2013–2015), volumes remain higher due to luxury appreciation, even with reduced transaction counts.
5. Value Per Square Foot
• Average $/Sq.Ft. nearly doubled over the cycle:
6. Luxury Dynamics & Sale-to-List Ratios
• Sale-to-List Ratios held steady at 98–99% for most of the cycle.
• 2020–2022 exceeded 100%, reflecting intense competition and bidding wars.
• By 2024–2025, ratios normalized to ~99%, confirming a shift back to buyer negotiation.
What This Means
• 2013–2019: Steady appreciation and consistent absorption — a balanced, healthy hillside submarket.
• 2020–2021: Unprecedented boom — record absorption, values, and velocity.
• 2022–2025: Correction phase — volumes and closure rates decline, $/Sq.Ft. softens, yet values remain far above early-decade levels.
Bottom Line
Hollywood Hills East remains a premium hillside market, shaped by its central location, luxury appeal, and limited land supply. While absorption and transaction counts have slowed dramatically since 2021, the neighborhood’s pricing resilience and long-term appreciation trajectory point to stability rather than collapse. Looking forward, modest appreciation is expected, but with slower turnover as higher financing costs and selective buyer demand temper market activity.
Hollywood Hills East has 23,109 households, with an average household size of 2. Data provided by the U.S. Census Bureau. Here’s what the people living in Hollywood Hills East do for work — and how long it takes them to get there. Data provided by the U.S. Census Bureau. 62,551 people call Hollywood Hills East home. The population density is 29,375 and the largest age group is Data provided by the U.S. Census Bureau.
Total Population
Population Density Population Density This is the number of people per square mile in a neighborhood.
Median Age
Men vs Women
Population by Age Group
0-9 Years
10-17 Years
18-24 Years
25-64 Years
65-74 Years
75+ Years
Education Level
Total Households
Average Household Size
Average individual Income
Households with Children
With Children:
Without Children:
Marital Status
Blue vs White Collar Workers
Blue Collar:
White Collar:
There's plenty to do around Hollywood Hills East, including shopping, dining, nightlife, parks, and more. Data provided by Walk Score and Yelp.
Explore popular things to do in the area, including Iby Mini Market, Artsakh Produce, and 560 North Kingsley Drive Entry.
| Name | Category | Distance | Reviews |
Ratings by
Yelp
|
|---|---|---|---|---|
| Dining | 0.4 miles | 0 reviews | 0/5 stars | |
| Dining | 0.51 miles | 0 reviews | 0/5 stars | |
| Dining | 0.58 miles | 0 reviews | 0/5 stars | |
| Dining | 0.82 miles | 0 reviews | 0/5 stars | |
| Dining | 0.82 miles | 0 reviews | 0/5 stars | |
| Dining | 0.82 miles | 0 reviews | 0/5 stars | |
| Active | 0.65 miles | 0 reviews | 0/5 stars | |
| Beauty | 0.27 miles | 1 review | 5/5 stars | |
| Beauty | 0.36 miles | 0 reviews | 0/5 stars | |
| Beauty | 0.46 miles | 0 reviews | 0/5 stars | |
| Beauty | 0.64 miles | 0 reviews | 0/5 stars | |
| Beauty | 0.64 miles | 1 review | 5/5 stars | |
| Beauty | 0.9 miles | 0 reviews | 0/5 stars | |
|
|
||||
|
|
||||
|
|
||||
|
|
||||
|
|
||||
|
|
Service Agreement.
We Will Run a Custom Search or Marketing Plan for Your specific needs.