17,372 people live in Malibu Beach, where the median age is 49 and the average individual income is $117,637. Data provided by the U.S. Census Bureau.
Total Population
Median Age
Population Density Population Density This is the number of people per square mile in a neighborhood.
Average individual Income
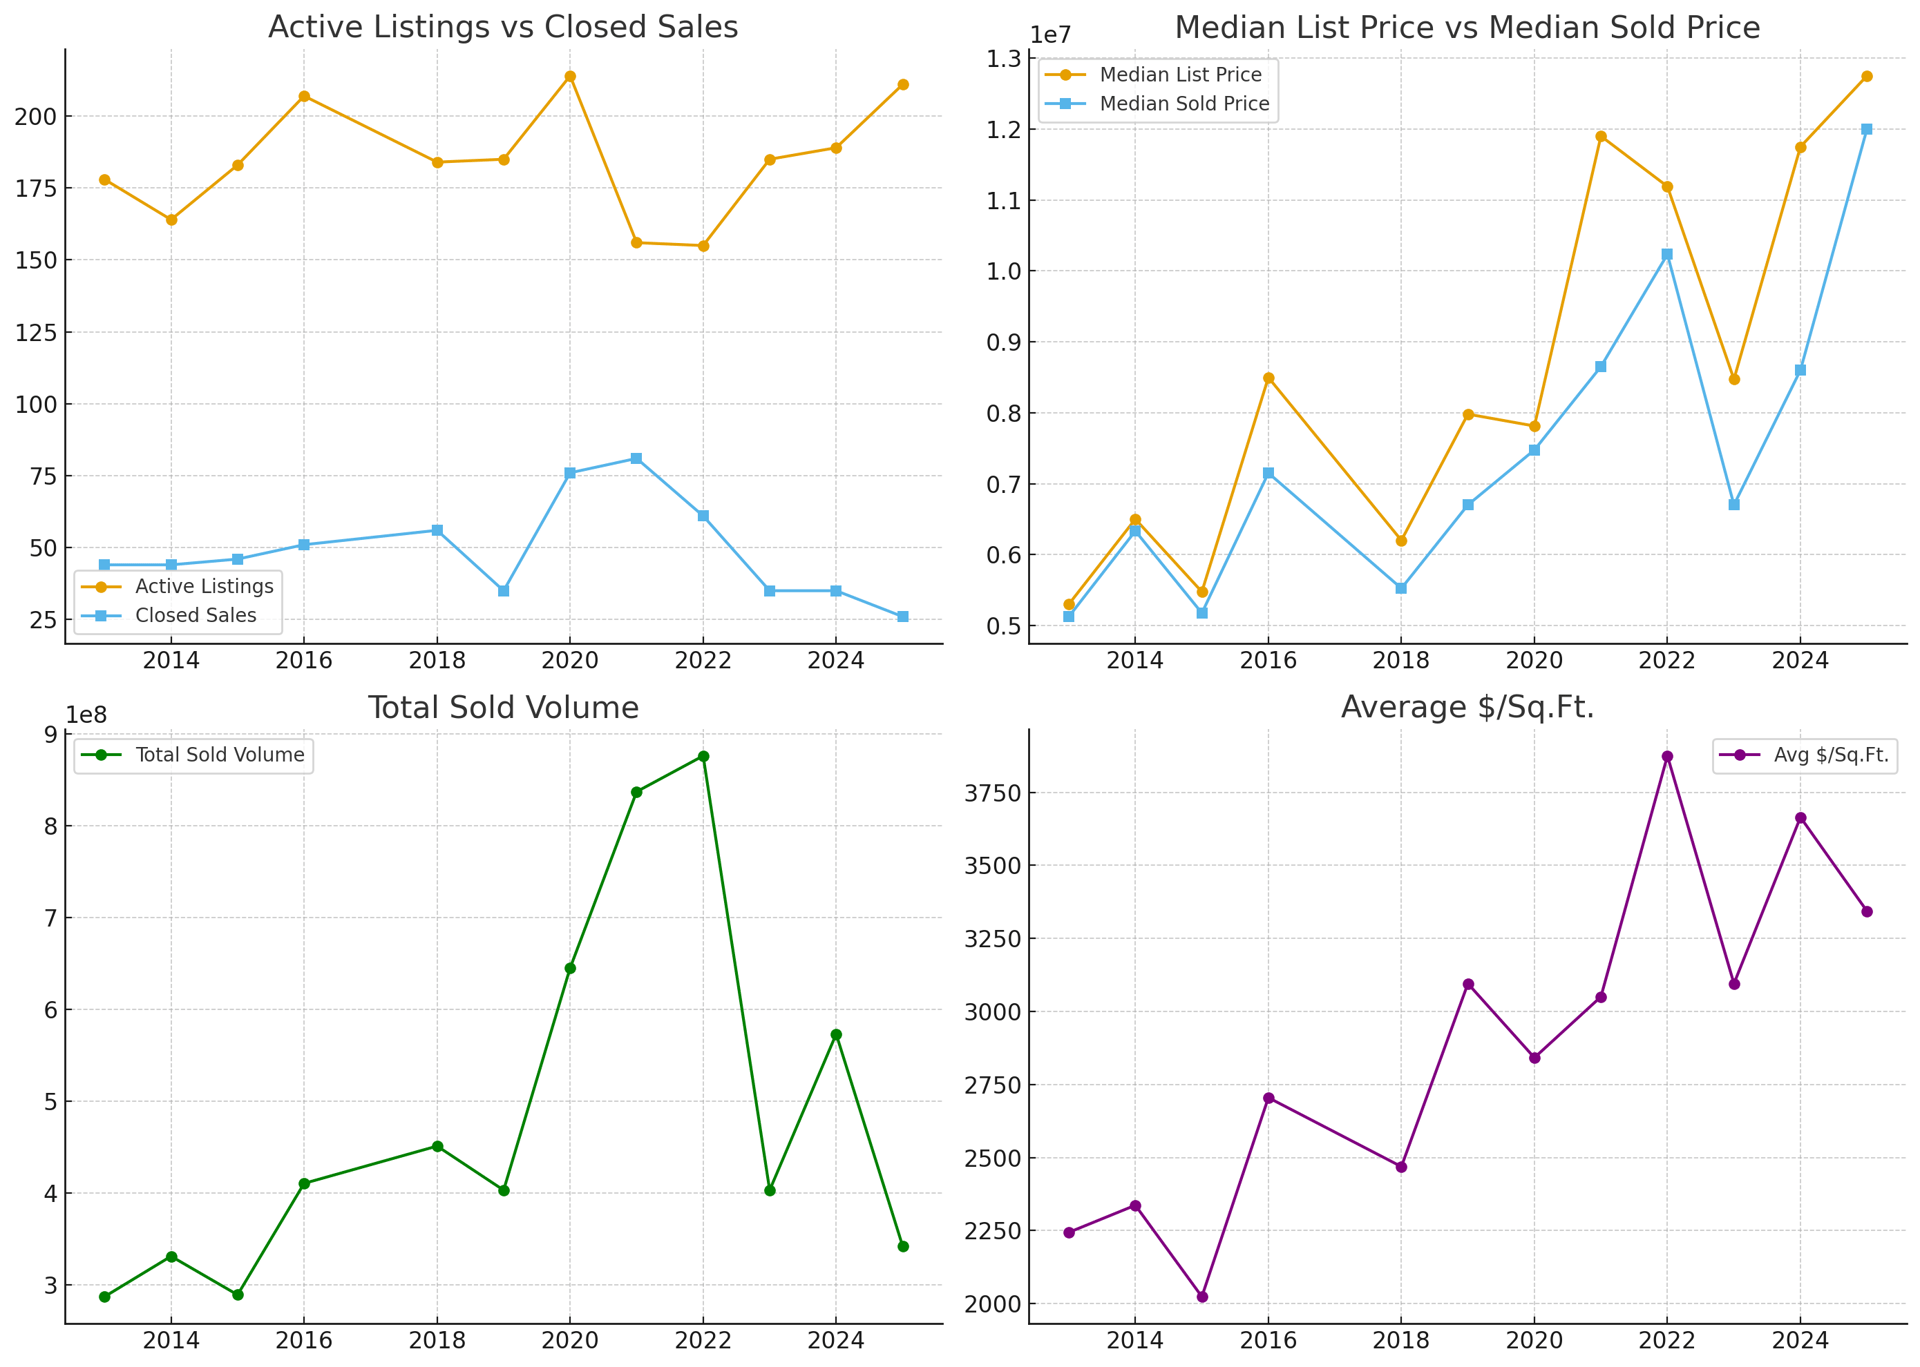
1. Active Listings & Closed Sales
Projection:
2. Closure Rate (Absorption)
3. Pricing Trends
4. Total Sold Volume
Projection:
5. Value Per Square Foot
6. Sale-to-List Ratios
Bottom Line
Malibu Beach is entering a low-volume, high-price equilibrium:
1. Market Activity: Active Listings & Closed Sales
2. Closure Rate (Absorption)
3. Pricing Trends: Median List vs. Median Sold
4. Total Sold Volume
5. Value Per Square Foot
6. Sale-to-List Ratios
What This Means
Bottom Line
Malibu Beach has shifted from ultra-hot luxury liquidity (2021–22) to a thin, illiquid market (2023–25). Trophy homes can still fetch record $/Sq.Ft., but broader absorption is extremely weak.
Malibu Beach has 6,119 households, with an average household size of 2. Data provided by the U.S. Census Bureau. Here’s what the people living in Malibu Beach do for work — and how long it takes them to get there. Data provided by the U.S. Census Bureau. 17,372 people call Malibu Beach home. The population density is 707 and the largest age group is Data provided by the U.S. Census Bureau.
Total Population
Population Density Population Density This is the number of people per square mile in a neighborhood.
Median Age
Men vs Women
Population by Age Group
0-9 Years
10-17 Years
18-24 Years
25-64 Years
65-74 Years
75+ Years
Education Level
Total Households
Average Household Size
Average individual Income
Households with Children
With Children:
Without Children:
Marital Status
Blue vs White Collar Workers
Blue Collar:
White Collar:
There's plenty to do around Malibu Beach, including shopping, dining, nightlife, parks, and more. Data provided by Walk Score and Yelp.
Explore popular things to do in the area, including Rancho Escondido, Nesse Foods, and Malibu Organic Lemon Company.
| Name | Category | Distance | Reviews |
Ratings by
Yelp
|
|---|---|---|---|---|
| Dining · $ | 0.75 miles | 0 reviews | 0/5 stars | |
| Dining | 0.75 miles | 0 reviews | 0/5 stars | |
| Dining | 0.75 miles | 0 reviews | 0/5 stars | |
| Dining | 0.75 miles | 0 reviews | 0/5 stars | |
| Dining · $$ | 0.75 miles | 0 reviews | 0/5 stars | |
| Active | 0.75 miles | 0 reviews | 0/5 stars | |
| Active | 0.75 miles | 0 reviews | 0/5 stars | |
| Active | 0.75 miles | 1 review | 5/5 stars | |
| Active | 0.75 miles | 6 reviews | 4.5/5 stars | |
| Active | 0.75 miles | 0 reviews | 0/5 stars | |
| Active | 0.75 miles | 6 reviews | 5/5 stars | |
| Active | 0.75 miles | 31 reviews | 4.2/5 stars | |
| Active | 0.75 miles | 2 reviews | 5/5 stars | |
| Active | 0.75 miles | 3 reviews | 5/5 stars | |
| Active | 0.75 miles | 28 reviews | 5/5 stars | |
| Nightlife | 0.75 miles | 0 reviews | 0/5 stars | |
| Beauty | 0.75 miles | 3 reviews | 5/5 stars | |
| Beauty | 0.75 miles | 0 reviews | 0/5 stars | |
| Beauty | 0.75 miles | 0 reviews | 0/5 stars | |
| Beauty | 0.75 miles | 19 reviews | 4.8/5 stars | |
| Beauty | 0.75 miles | 0 reviews | 0/5 stars | |
| Beauty | 0.75 miles | 3 reviews | 5/5 stars | |
| Beauty | 0.75 miles | 0 reviews | 0/5 stars | |
| Beauty | 0.75 miles | 0 reviews | 0/5 stars | |
|
|
||||
|
|
||||
|
|
||||
|
|
||||
|
|
||||
|
|
Service Agreement.
We Will Run a Custom Search or Marketing Plan for Your specific needs.