23,717 people live in Palisades, where the median age is 47 and the average individual income is $135,206. Data provided by the U.S. Census Bureau.
Total Population
Median Age
Population Density Population Density This is the number of people per square mile in a neighborhood.
Average individual Income
2026
• Active Listings: Expected to stay elevated at 220–240, reflecting cautious sellers but limited buyer depth.
• Closed Sales: Modest recovery to 50–60 transactions, up from 2025’s extreme low.
• Median Prices: Stable, list ~$4.2M–$4.3M, sold ~$4.0M–$4.1M.
• $/Sq.Ft.: ~$1,480–$1,520, holding near 2025 levels.
• Key Factor: Higher-for-longer mortgage rates keep sales sluggish, but Pacific Palisades’ family appeal and coastal prestige prevent price erosion.
2027
• Active Listings: Decline slightly to 210–225, as weaker sellers exit.
• Closed Sales: Rebound to 65–75 transactions, reflecting improved absorption.
• Median Prices: Modest appreciation, list ~$4.3M–$4.4M, sold ~$4.1M–$4.2M.
• $/Sq.Ft.: ~$1,520–$1,580, lifted by demand for newly renovated homes and canyon/ocean view estates.
• Key Factor: Easing financial conditions and global capital inflows revive high-end activity.
2028
• Active Listings: Normalize at 200–215, closer to long-term averages.
• Closed Sales: Strengthen further to 80–90 transactions, approaching pre-pandemic levels.
• Median Prices: Renewed appreciation, list ~$4.4M–$4.6M, sold ~$4.2M–$4.4M.
• $/Sq.Ft.: ~$1,580–$1,650, regaining momentum toward the 2022 peak.
• Key Factor: Strong demand from affluent domestic and international buyers, combined with limited new construction, sustains growth.
Summary Projection
• Short-term (2026): Stabilization — turnover slightly improves, but pricing remains flat.
• Mid-term (2027): Gradual recovery, stronger absorption, and mild appreciation.
• Long-term (2028): Market rebalances, transactions regain healthier levels, and $/Sq.Ft. pushes upward again.
Bottom Line: Pacific Palisades is exiting its 2023–2025 correction. While turnover will remain slower than peak years, pricing resilience, family demand, and coastal prestige ensure long-term value growth, with gradual recovery in both volume and $/Sq.Ft. through 2028.
1. Market Activity: Active Listings & Closed Sales
• Active Listings generally held between 384–544 from 2013–2021, peaking in 2016 with 544 listings.
• Closed Sales were strongest in 2021 with 291 transactions, aligning with the nationwide housing boom.
• By 2025, closed sales collapsed to just 39, down nearly 87% from 2021, reflecting one of the weakest absorption rates in over a decade.
2. Closure Rate (Absorption)
• 2013–2017: A strong era with closure rates in the 48–63% range, showing healthy buyer demand.
• 2018–2020: Absorption weakened to the 33–43% range, reflecting slower luxury turnover.
• 2021–2022: Spiked back to 58.3%, showing peak demand and liquidity.
• 2025: Fell sharply to 17.6%, the lowest of the series, meaning fewer than 1 in 5 listings closed.
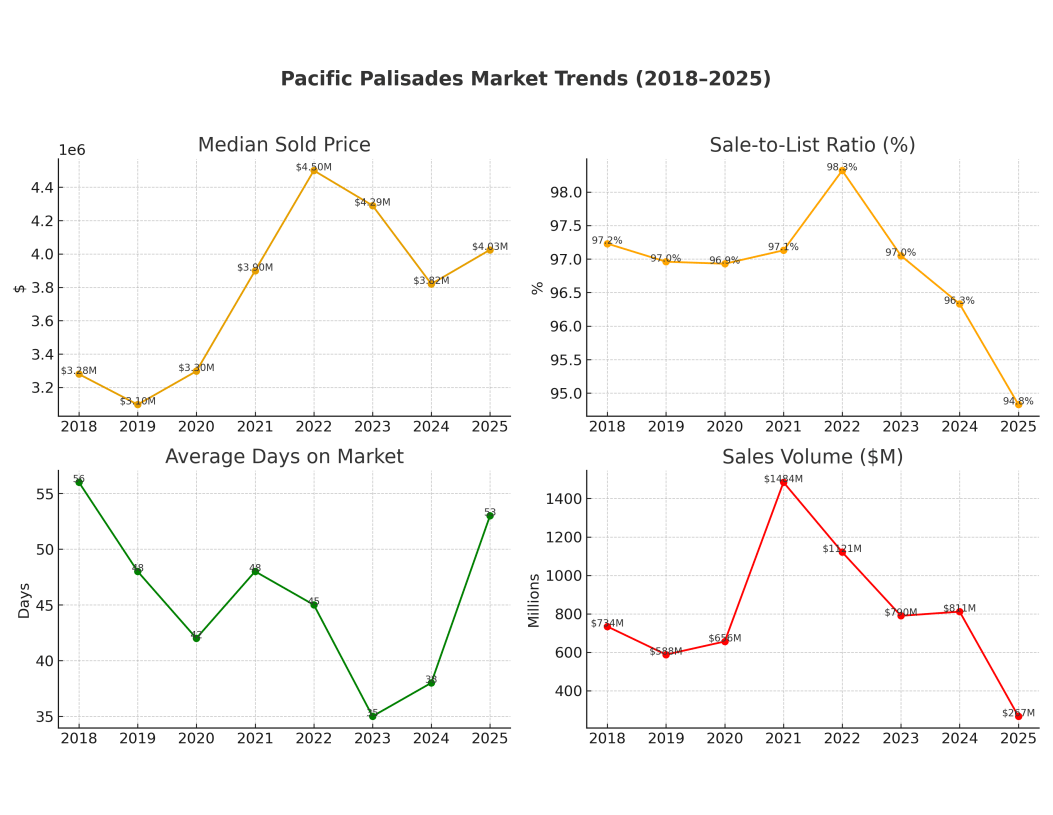
3. Pricing Trends: Median List vs. Median Sold
• Median List Price climbed from $2.28M (2013) to $4.2M (2025).
• Median Sold Price rose from $2.24M (2013) to $4.03M (2025).
• Market Phases:
4. Total Sold Volume
• 2013–2017: Annual volume ranged between $892M–$1.04B, with steady turnover.
• 2021: Reached a record $1.48B, driven by high sales and strong pricing.
• 2022: Still robust at $1.12B, despite fewer listings.
• 2025: Fell dramatically to just $267M, down 82% from peak, underscoring the market freeze.
5. Value Per Square Foot
• 2013: Averaged $841/Sq.Ft.
• 2017: Reached $1,125/Sq.Ft.
• 2021: Climbed to $1,253/Sq.Ft., a pandemic-era peak.
• 2022: Hit a record $1,560/Sq.Ft., reflecting bidding wars and trophy purchases.
• 2025: Corrected to $1,508/Sq.Ft., still nearly double 2013 levels despite weaker absorption.
6. Sale-to-List Ratios
• Consistently strong, ranging from 94.8% (2025) to 98.6% (2013).
• 2022: Tightened to 98.3%, showing buyers paying very close to asking.
• 2025: Fell to 94.8%, the lowest of the dataset, showing heavier buyer leverage.
What This Means
• 2013–2017: A period of healthy liquidity and steady appreciation.
• 2018–2020: Softer absorption, though prices continued to edge upward.
• 2021–2022: A historic surge — record-high sales, volumes, and price per square foot.
• 2023–2025: A sharp correction — sales volume collapsed, absorption fell, and discounts widened, but overall price levels remain historically high.
Bottom Line
Pacific Palisades remains one of Los Angeles’ most desirable coastal luxury markets. Despite the post-2022 downturn in sales activity, values remain resilient, supported by limited supply and global demand. Over the next cycle, expect stable-to-modest price growth but slower turnover, as the market recalibrates from its historic 2021–2022 highs.
Palisades has 9,311 households, with an average household size of 3. Data provided by the U.S. Census Bureau. Here’s what the people living in Palisades do for work — and how long it takes them to get there. Data provided by the U.S. Census Bureau. 23,717 people call Palisades home. The population density is 4,322 and the largest age group is Data provided by the U.S. Census Bureau.
Total Population
Population Density Population Density This is the number of people per square mile in a neighborhood.
Median Age
Men vs Women
Population by Age Group
0-9 Years
10-17 Years
18-24 Years
25-64 Years
65-74 Years
75+ Years
Education Level
Total Households
Average Household Size
Average individual Income
Households with Children
With Children:
Without Children:
Marital Status
Blue vs White Collar Workers
Blue Collar:
White Collar:
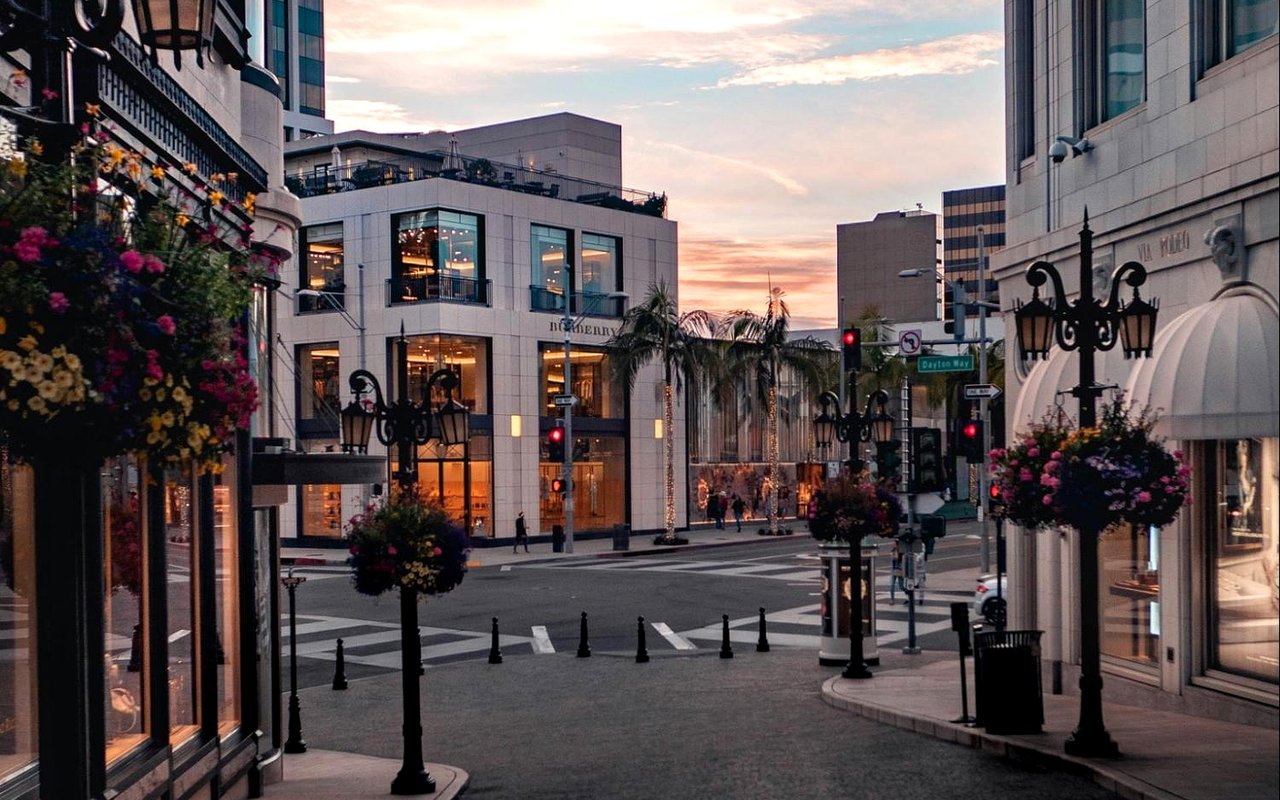
There's plenty to do around Palisades, including shopping, dining, nightlife, parks, and more. Data provided by Walk Score and Yelp.
Explore popular things to do in the area, including Lulu’s Custom Cakery, Beggies, and Chevron.
| Name | Category | Distance | Reviews |
Ratings by
Yelp
|
|---|---|---|---|---|
| Dining | 0.45 miles | 14 reviews | 4.9/5 stars | |
| Dining | 2 miles | 0 reviews | 0/5 stars | |
| Dining | 2.75 miles | 0 reviews | 0/5 stars | |
| Shopping | 2.44 miles | 1 review | 5/5 stars | |
| Shopping | 2.55 miles | 4 reviews | 5/5 stars | |
| Shopping | 2.59 miles | 10 reviews | 5/5 stars | |
| Active | 0.45 miles | 1 review | 1/5 stars | |
| Active | 2.09 miles | 0 reviews | 0/5 stars | |
| Active | 2.17 miles | 0 reviews | 0/5 stars | |
| Active | 2.42 miles | 1 review | 5/5 stars | |
| Active | 2.42 miles | 1 review | 5/5 stars | |
| Active | 2.58 miles | 0 reviews | 0/5 stars | |
| Active | 2.75 miles | 0 reviews | 0/5 stars | |
| Nightlife | 0.26 miles | 0 reviews | 0/5 stars | |
| Beauty | 0.26 miles | 6 reviews | 4.3/5 stars | |
| Beauty | 2.3 miles | 3 reviews | 5/5 stars | |
| Beauty | 2.4 miles | 0 reviews | 0/5 stars | |
| Beauty | 2.41 miles | 0 reviews | 0/5 stars | |
| Beauty | 2.42 miles | 0 reviews | 0/5 stars | |
| Beauty | 2.44 miles | 11 reviews | 3.7/5 stars | |
| Beauty | 2.45 miles | 51 reviews | 5/5 stars | |
| Beauty | 2.56 miles | 1 review | 5/5 stars | |
| Beauty | 2.59 miles | 3 reviews | 2.3/5 stars | |
|
|
||||
|
|
||||
|
|
||||
|
|
||||
|
|
||||
|
|
Service Agreement.
We Will Run a Custom Search or Marketing Plan for Your specific needs.