91,535 people live in Santa Monica, where the median age is 42.9 and the average individual income is $90,657. Data provided by the U.S. Census Bureau.
Total Population
Median Age
Population Density Population Density This is the number of people per square mile in a neighborhood.
Average individual Income
2026
• Active Listings: Expected to hold at 400–420, reflecting steady seller interest but selective demand.
• Closed Sales: Likely around 190–200, consistent with 2025’s pace.
• Median Prices: Flat-to-slight gains, list ~$4.3M–$4.4M, sold ~$4.25M–$4.35M.
• $/Sq.Ft.: ~$1,670–$1,710, maintaining 2025’s high baseline.
• Key Factor: Mortgage rates remain elevated, slowing absorption, but Santa Monica’s lifestyle appeal keeps values stable.
2027
• Active Listings: Eases slightly to 380–400, as discretionary sellers exit the market.
• Closed Sales: Modest rebound to 200–215 transactions, suggesting stronger buyer absorption.
• Median Prices: Gradual appreciation, list ~$4.4M–$4.5M, sold ~$4.3M–$4.4M.
• $/Sq.Ft.: Pushes to ~$1,720–$1,770, reflecting premiums for turnkey and ocean-view properties.
• Key Factor: Inflation cooling and improved lending conditions draw more buyers back into the luxury market.
2028
• Active Listings: Normalizes at 370–390, aligned with long-term averages.
• Closed Sales: Strengthens further to 220–230, approaching pre-pandemic levels.
• Median Prices: Renewed growth, list ~$4.5M–$4.7M, sold ~$4.4M–$4.6M.
• $/Sq.Ft.: Could test $1,780–$1,850, continuing an upward but sustainable trend.
• Key Factor: International wealth and tech-driven demand maintain Santa Monica’s long-term desirability, even as turnover stabilizes.
Summary Projection
• Short-term (2026): Stabilization — sales hold steady, pricing remains strong.
• Mid-term (2027): Gradual recovery — improved absorption and modest appreciation.
• Long-term (2028): Rebalancing — healthier turnover, with values continuing to climb at a sustainable pace.
Bottom Line: Santa Monica is shifting from a high-intensity cycle (2021–2022) into a stabilized growth phase (2026–2028). While volumes won’t match peak years, the submarket’s premium appeal, limited supply, and oceanfront lifestyle ensure lasting pricing resilience and steady appreciation.
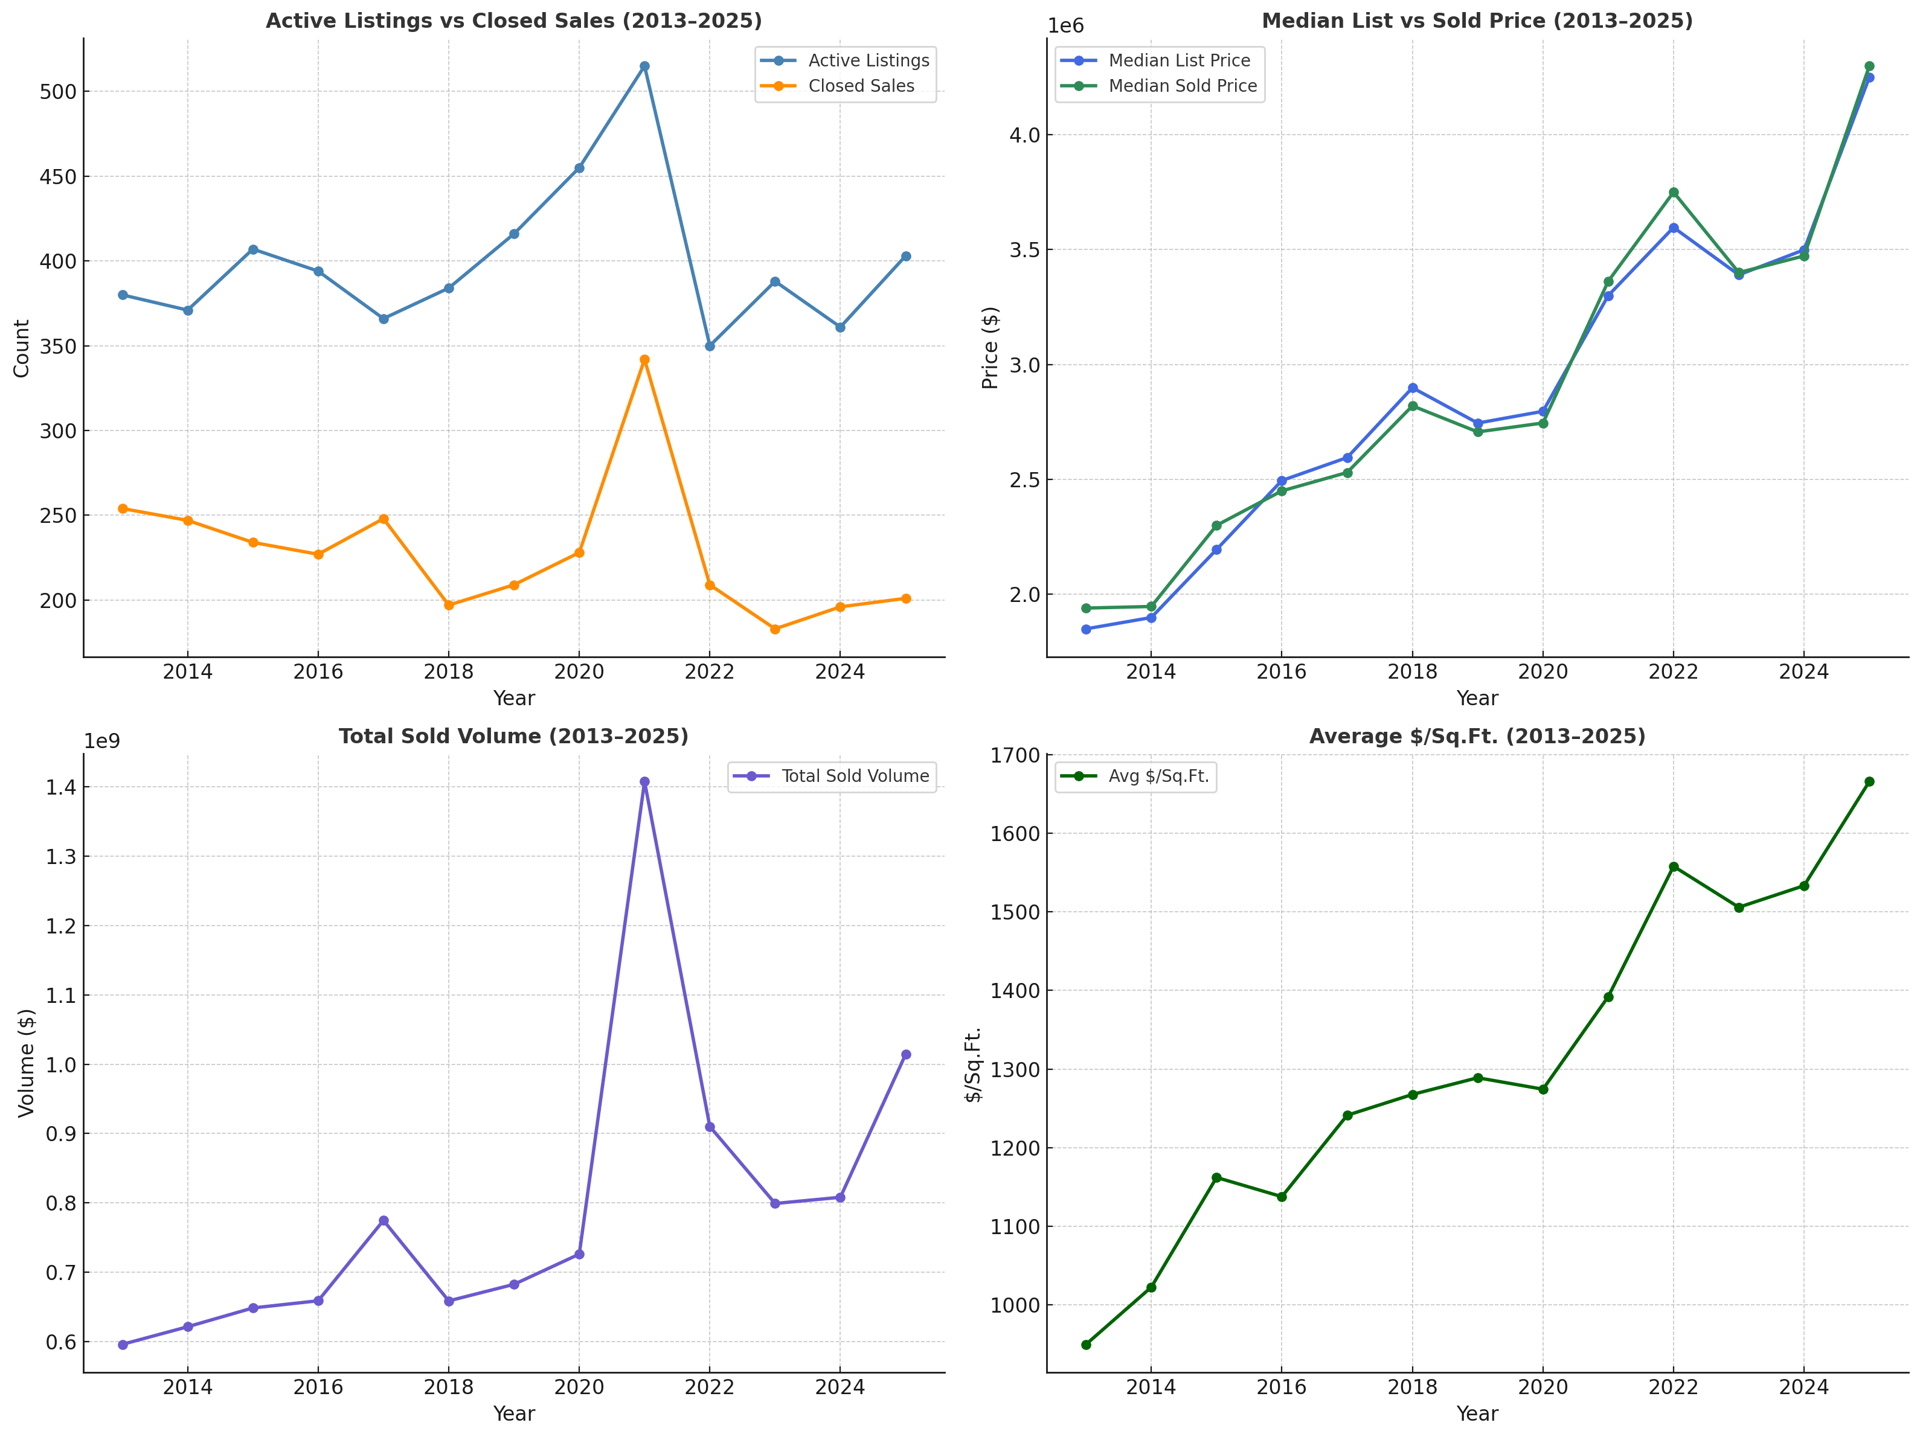
Analysis of Santa Monica (2013–2025)
1. Market Activity: Active Listings & Closed Sales
• Active Listings ranged between 350–515, peaking in 2021 with 515 listings.
• Closed Sales also peaked in 2021 at 342 transactions, coinciding with the nationwide COVID-era housing surge.
• By 2025, closed sales softened to 201, showing a 41% decline from the 2021 peak, though the market remained more liquid than other coastal submarkets.
2. Closure Rate (Absorption)
• 2013–2017: Strong, with absorption in the 57–68% range, reflecting steady buyer demand.
• 2018–2020: Dipped to ~50%, showing slower turnover despite stable listings.
• 2021: Surged to 66.4%, confirming peak liquidity.
• 2022–2025: Held between 47–59%, stronger than many peers, though trending weaker by 2025 at 49.9%.
3. Pricing Trends: Median List vs. Median Sold
• Median List Price rose from $1.85M (2013) to $4.25M (2025).
• Median Sold Price increased from $1.94M (2013) to $4.30M (2025).
• Market Phases:
• 2013–2017: Consistent appreciation, sold prices nearly equal to list.
• 2018–2020: Pricing momentum slowed, but values held strong.
• 2021–2022: Breakout years — median sold exceeded list in both years, with buyers paying premiums.
• 2023–2025: Prices remained elevated, though negotiation widened and absorption slowed.
4. Total Sold Volume
• 2013–2017: Annual volume stable between $596M–$775M.
• 2021: Hit a record $1.4B, the highest of the series.
• 2022–2024: Adjusted down to ~$800M–$910M annually, reflecting lower closings but sustained high pricing.
• 2025: Rebounded to just over $1.0B, demonstrating renewed strength despite softer absorption.
5. Value Per Square Foot
• 2013: $950/Sq.Ft. average.
• 2017: $1,241/Sq.Ft., marking a strong pre-pandemic baseline.
• 2021: Jumped to $1,392/Sq.Ft. at the market peak.
• 2022: Set a record at $1,558/Sq.Ft. amid intense competition.
• 2025: Climbed further to $1,666/Sq.Ft., nearly doubling 2013 levels, underscoring lasting pricing power.
6. Sale-to-List Ratios
• Consistently strong, ranging from 96.9% (2023) to 101.4% (2025).
• 2021–2022: Buyers often paid at or above asking, reflecting intense competition.
• 2025: Ratios back above 101%, showing sellers regained pricing control despite fewer sales.
What This Means
• 2013–2017: A stable and highly liquid market with steady appreciation.
• 2018–2020: A plateau, with absorption dipping but prices holding firm.
• 2021–2022: Peak momentum — record-high sales, volumes, and premiums above asking.
• 2023–2025: A rebalancing — sales counts fell, but pricing and $/Sq.Ft. remained historically high.
Bottom Line
Santa Monica continues to stand out as one of Los Angeles’ premier luxury submarkets. While transaction volumes have cooled since the 2021 frenzy, pricing resilience and record $/Sq.Ft. in 2025 highlight the enduring desirability of Santa Monica real estate. Looking forward, expect slower turnover but sustained high values, supported by international demand, coastal scarcity, and strong lifestyle appeal.
Santa Monica has 46,457 households, with an average household size of 1.92. Data provided by the U.S. Census Bureau. Here’s what the people living in Santa Monica do for work — and how long it takes them to get there. Data provided by the U.S. Census Bureau. 91,535 people call Santa Monica home. The population density is 10,884 and the largest age group is Data provided by the U.S. Census Bureau.
Total Population
Population Density Population Density This is the number of people per square mile in a neighborhood.
Median Age
Men vs Women
Population by Age Group
0-9 Years
10-17 Years
18-24 Years
25-64 Years
65-74 Years
75+ Years
Education Level
Total Households
Average Household Size
Average individual Income
Households with Children
With Children:
Without Children:
Marital Status
Blue vs White Collar Workers
Blue Collar:
White Collar:
There's plenty to do around Santa Monica, including shopping, dining, nightlife, parks, and more. Data provided by Walk Score and Yelp.
Explore popular things to do in the area, including Juice, Chevron, and Value Health Sciences.
| Name | Category | Distance | Reviews |
Ratings by
Yelp
|
|---|---|---|---|---|
| Dining | 0.49 miles | 0 reviews | 0/5 stars | |
| Dining | 0.59 miles | 16 reviews | 1.8/5 stars | |
| Dining | 0.62 miles | 0 reviews | 0/5 stars | |
| Dining | 0.7 miles | 0 reviews | 0/5 stars | |
| Dining | 0.7 miles | 1 review | 5/5 stars | |
| Shopping | 0.42 miles | 0 reviews | 0/5 stars | |
| Active | 0.32 miles | 3 reviews | 5/5 stars | |
| Active | 0.41 miles | 0 reviews | 0/5 stars | |
| Active | 0.43 miles | 0 reviews | 0/5 stars | |
| Active | 0.51 miles | 0 reviews | 0/5 stars | |
| Active | 0.51 miles | 25 reviews | 3.4/5 stars | |
| Active | 0.52 miles | 1 review | 5/5 stars | |
| Active | 0.53 miles | 1 review | 5/5 stars | |
| Active | 0.66 miles | 0 reviews | 0/5 stars | |
| Active | 0.7 miles | 0 reviews | 0/5 stars | |
| Active | 0.7 miles | 0 reviews | 0/5 stars | |
| Nightlife | 0.41 miles | 0 reviews | 0/5 stars | |
| Beauty | 0.45 miles | 5 reviews | 5/5 stars | |
| Beauty | 0.5 miles | 1 review | 2/5 stars | |
| Beauty | 0.5 miles | 2 reviews | 5/5 stars | |
| Beauty | 0.65 miles | 1 review | 5/5 stars | |
| Beauty | 0.65 miles | 6 reviews | 5/5 stars | |
| Beauty | 0.7 miles | 1 review | 5/5 stars | |
|
|
||||
|
|
||||
|
|
||||
|
|
||||
|
|
||||
|
|
Service Agreement.
We Will Run a Custom Search or Marketing Plan for Your specific needs.