Bel Air/Holmby Hills
|
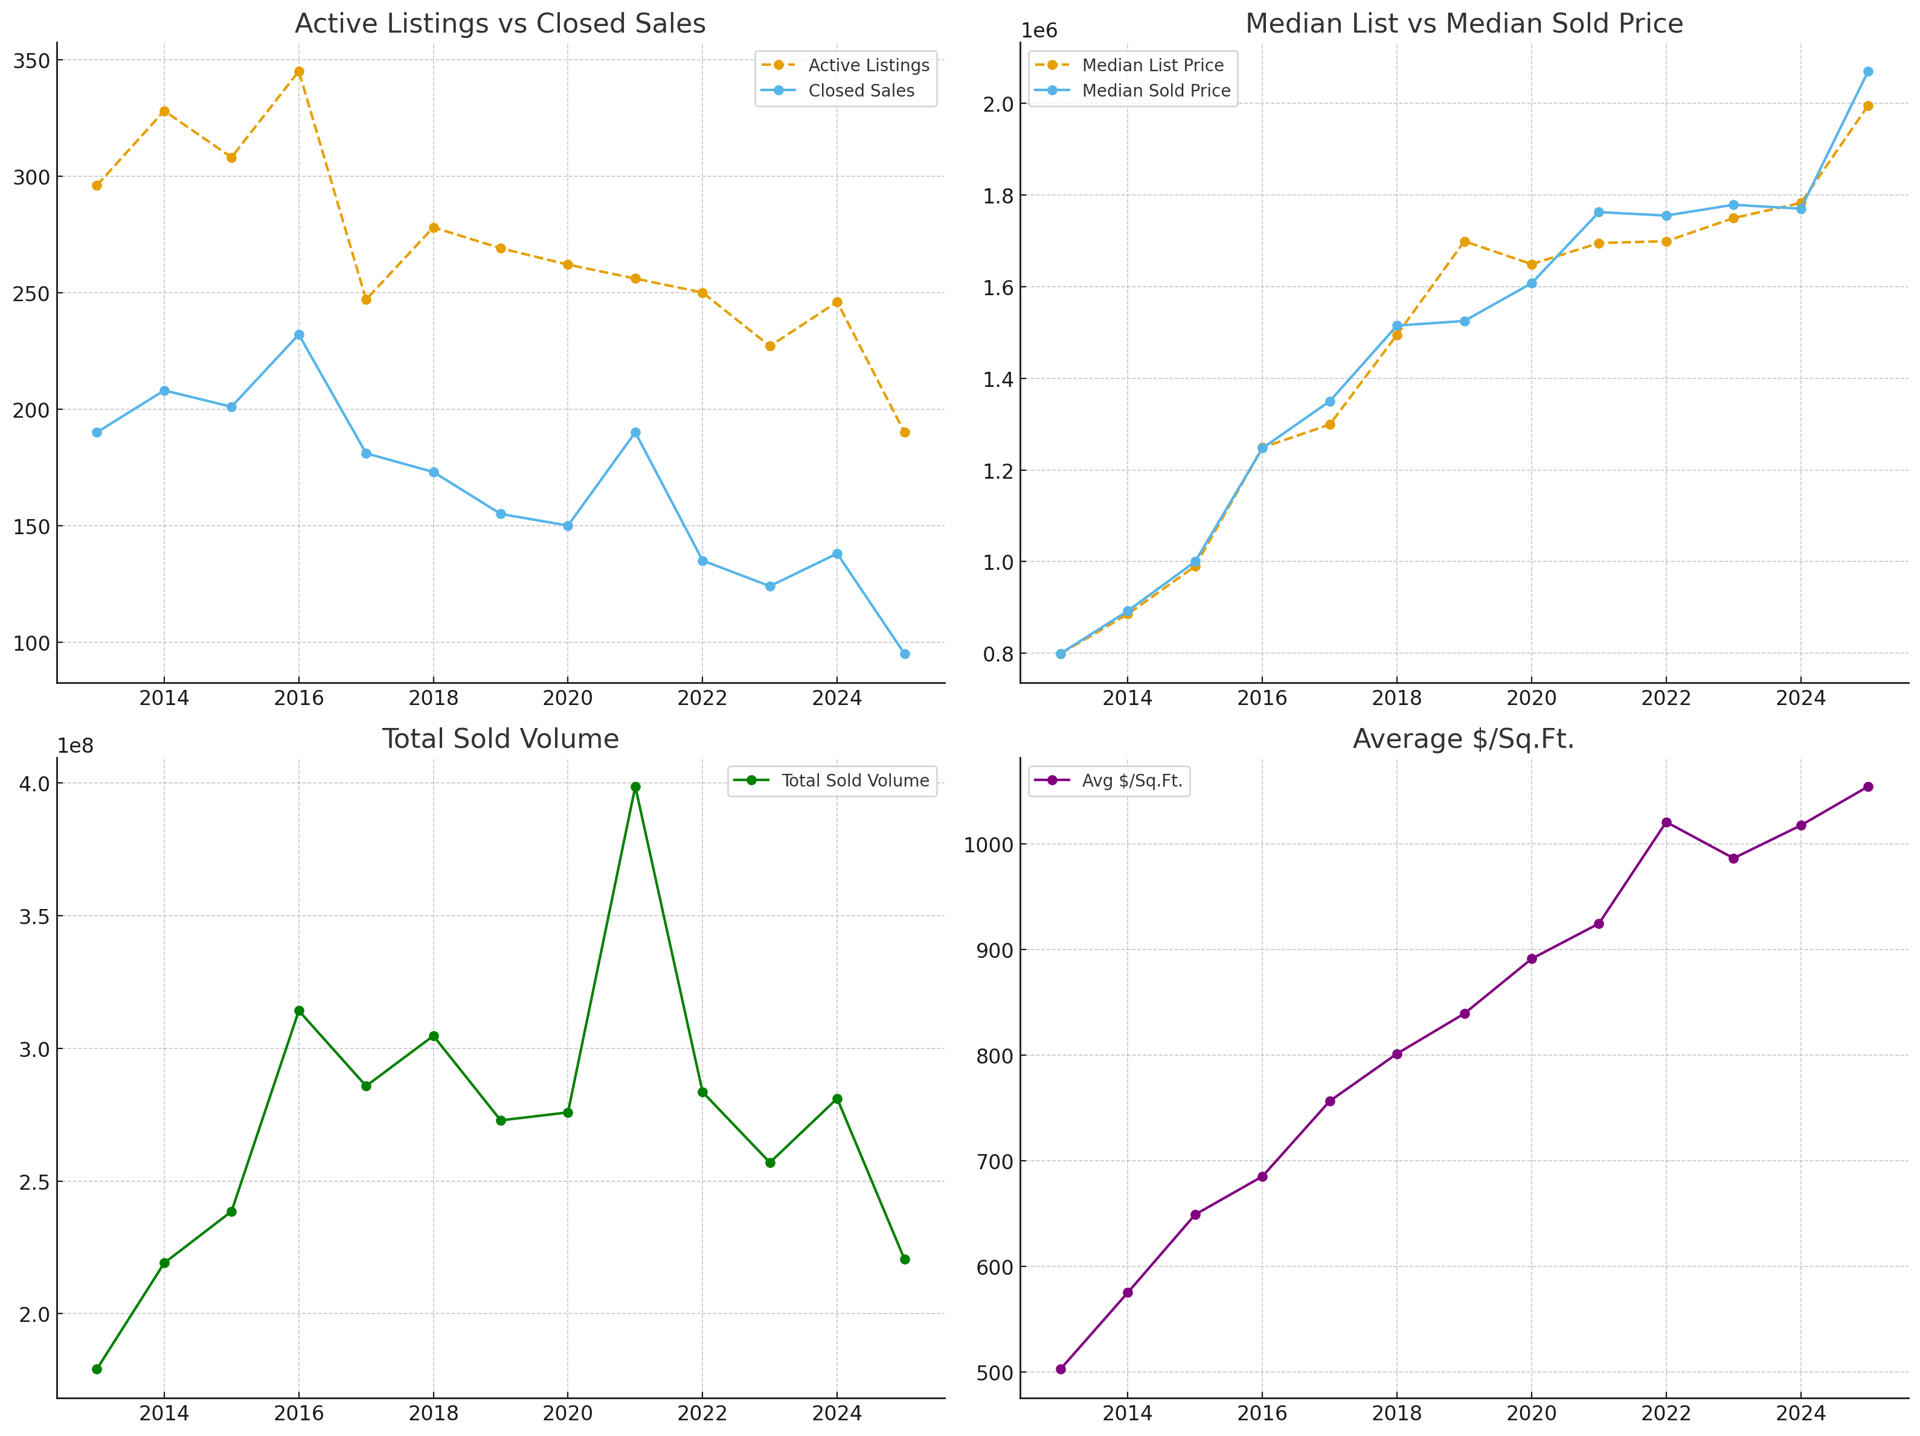
Year |
Active Listings |
Closed Sales |
Closure Rate |
Median List Price |
Median Sold Price |
Min Price Sold |
Max Price Sold |
Avg List Price |
Avg Sold Price |
DOM Closed |
Avg $/Sq.Ft. |
Total Leased Volume |
|
2013 |
226 |
120 |
53.1% |
$5,997.00 |
$5,997.00 |
$1,000.00 |
$85,000.00 |
$13,678.00 |
$21,282.00 |
59 |
$7.45 |
$1,303,800.00 |
|
2014 |
231 |
119 |
51.5% |
$6,500.00 |
$6,500.00 |
$925.00 |
$90,000.00 |
$15,664.00 |
$13,049.00 |
72 |
$3.01 |
$1,152,795.00 |
|
2015 |
210 |
107 |
51.0% |
$6,500.00 |
$6,300.00 |
$1,150.00 |
$55,000.00 |
$17,834.00 |
$11,146.00 |
54 |
$3.12 |
$892,615.00 |
|
2016 |
258 |
117 |
45.3% |
$7,400.00 |
$7,250.00 |
$1,995.00 |
$155,000.00 |
$20,914.00 |
$12,177.00 |
49 |
$3.19 |
$1,424,699.00 |
|
2017 |
250 |
96 |
38.4% |
$7,625.00 |
$7,557.00 |
$1,399.00 |
$43,000.00 |
$24,814.00 |
$14,123.00 |
70 |
$3.20 |
$910,812.00 |
|
2018 |
249 |
110 |
44.2% |
$8,300.00 |
$8,050.00 |
$2,295.00 |
$65,000.00 |
$27,530.00 |
$18,609.00 |
68 |
$3.47 |
$1,291,974.00 |
|
2019 |
282 |
120 |
42.6% |
$9,900.00 |
$9,850.00 |
$1,150.00 |
$100,000.00 |
$29,594.00 |
$22,088.00 |
76 |
$4.05 |
$1,911,570.00 |
|
2020 |
271 |
126 |
46.5% |
$9,995.00 |
$9,125.00 |
$1,795.00 |
$135,000.00 |
$24,574.00 |
$13,830.00 |
43 |
$3.35 |
2,548,821.00 |
|
2021 |
251 |
128 |
51.0% |
$8,997.00 |
$9,000.00 |
$1,495.00 |
$225,000.00 |
$30,662.00 |
$26,944.00 |
62 |
$4.25 |
$1,833,554.00 |
|
2022 |
236 |
115 |
48.7% |
$9,995.00 |
$9,700.00 |
$1,750.00 |
$200,000.00 |
$34,620.00 |
$19,335.00 |
49 |
$4.27 |
$2,223,554.00 |
|
2023 |
373 |
150 |
40.2% |
$8,492.00 |
$8,100.00 |
$1,900.00 |
$185,000.00 |
$28,318.00 |
$13,965.00 |
49 |
$4.31 |
$2,094,689.00 |
|
2024 |
300 |
136 |
45.3% |
$6,950.00 |
$6,950.00 |
$1,750.00 |
$185,000.00 |
$33,314.00 |
$13,086.00 |
59 |
$4.38 |
$1,779,760.00 |
|
2025 |
309 |
129 |
41.7% |
$10,500.00 |
$10,000.00 |
$1,850.00 |
$180,000.00 |
$35,497.00 |
$16,077.00 |
57 |
$4.95 |
$2,173,922.00 |
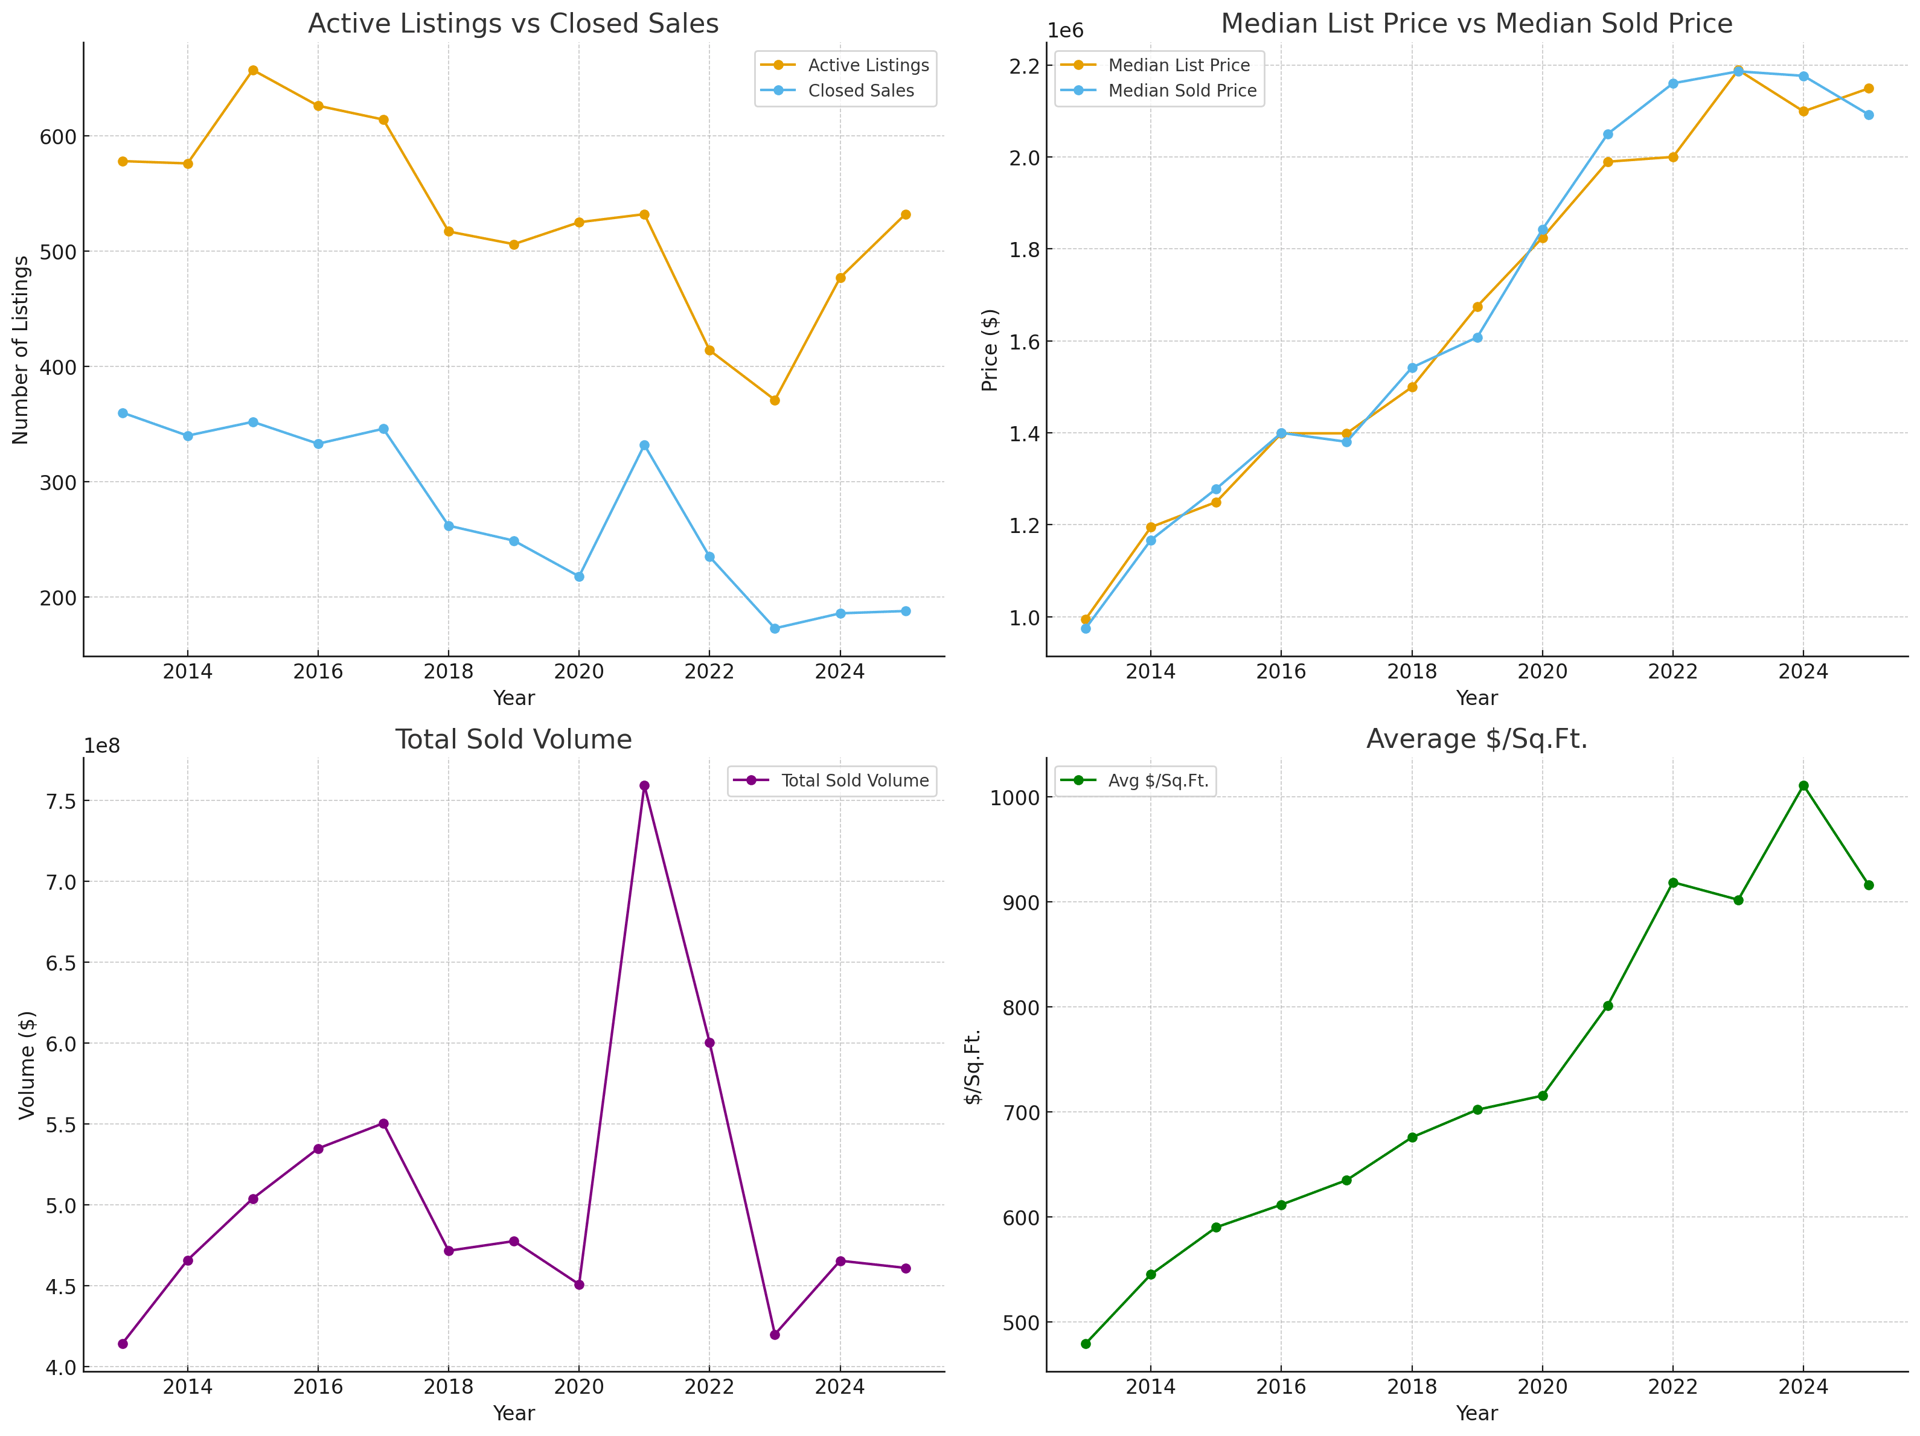
Beverly Hills
|
Year |
Active Listings |
Closed Leases |
Closure Rate (%) |
Median List Price ($) |
Median Leased Price ($) |
Average Lease Price ($) |
Min Price ($) |
Max Price ($) |
Avg Days to Lease |
Avg $/Sq.Ft. |
Total Leased Volume ($) |
|
2013 |
664 |
345 |
51.95% |
$4,798.00 |
$4,750.00 |
$7,917.00 |
$1,500.00 |
$65,000.00 |
46 |
$2.86 |
$2,731,408.00 |
|
2014 |
740 |
369 |
49.86% |
$5,000.00 |
$5,000.00 |
$10,505.00 |
$1,400.00 |
$80,000.00 |
53 |
$3.42 |
$3,876,243.00 |
|
2015 |
765 |
369 |
48.24% |
$5,500.00 |
$5,300.00 |
$9,720.00 |
$1,600.00 |
$80,000.00 |
52 |
$3.66 |
$3,586,561.00 |
|
2016 |
895 |
424 |
47.37% |
$5,718.00 |
$5,625.00 |
$11,163.00 |
$1,250.00 |
$130,000.00 |
56 |
$4.66 |
$4,733,174.00 |
|
2017 |
1,103 |
442 |
40.07% |
$5,733.00 |
$5,625.00 |
$11,839.00 |
$1,200.00 |
$300,000.00 |
54 |
$3.80 |
$5,232,792.00 |
|
2018 |
1,122 |
501 |
44.65% |
$5,700.00 |
$5,500.00 |
$10,386.00 |
$1,395.00 |
$250,000.00 |
64 |
$3.62 |
$5,203,158.00 |
|
2019 |
1,174 |
476 |
40.54% |
$6,000.00 |
$5,925.00 |
$10,478.00 |
$1,625.00 |
$150,000.00 |
51 |
$3.63 |
$4,987,345.00 |
|
2020 |
1,354 |
471 |
34.77% |
$5,674.00 |
$5,500.00 |
$32,399.00 |
$1,495.00 |
$165,000.00 |
51 |
$7.16 |
$5,092,113.00 |
|
2021 |
1,239 |
552 |
44.55% |
$5,492.00 |
$5,272.00 |
$11,612.00 |
$1,495.00 |
$130,000.00 |
58 |
$4.06 |
$6,409,617.00 |
|
2022 |
1,060 |
469 |
44.25% |
$6,000.00 |
$6,000.00 |
$11,447.00 |
$1,500.00 |
$127,500.00 |
46 |
$4.37 |
$5,368,801.00 |
|
2023 |
1,146 |
504 |
43.98% |
$6,226.00 |
$6,200.00 |
$11,289.00 |
$1,500.00 |
$126,000.00 |
60 |
$4.09 |
$5,689,543.00 |
|
2024 |
1,148 |
517 |
45.03% |
$6,950.00 |
$6,700.00 |
$12,074.00 |
$1,795.00 |
$110,000.00 |
57 |
$4.25 |
$6,242,179.00 |
|
2025 |
984 |
412 |
41.87% |
$6,500.00 |
$6,497.00 |
$13,430.00 |
$1,795.00 |
$155,000.00 |
47 |
$4.74 |
$5,533,236.00 |
Beverly Hills Post Office (BHPO)
|
Year |
Active Listings |
Closed Leases |
Closure Rate (%) |
Median List Price ($) |
Median Leased Price ($) |
Average Lease Price ($) |
Minimum Price ($) |
Maximum Price ($) |
Avg Days to Lease |
Avg Price per Sq.Ft ($) |
Total Leased Volume ($) |
|
2013 |
238 |
103 |
43.28 |
$9,750.00 |
$8,800.00 |
$16,239.00 |
$3,000.00 |
$114,000.00 |
65 |
$3.59 |
$1,560,094.00 |
|
2014 |
227 |
87 |
38.33 |
$10,000.00 |
$9,000.00 |
$14,862.00 |
$2,250.00 |
$100,000.00 |
80 |
$3.67 |
$1,293,012.00 |
|
2015 |
253 |
88 |
34.78 |
$9,837.00 |
$8,887.00 |
$15,182.00 |
$3,600.00 |
$140,000.00 |
63 |
$3.84 |
$1,336,019.00 |
|
2016 |
289 |
108 |
37.37 |
$9,650.00 |
$9,900.00 |
$14,391.00 |
$2,495.00 |
$100,000.00 |
60 |
$3.96 |
$1,554,262.00 |
|
2017 |
315 |
105 |
33.33 |
$11,000.00 |
$11,500.00 |
$16,445.00 |
$800.00 |
$120,000.00 |
79 |
$3.92 |
$1,726,687.00 |
|
2018 |
293 |
98 |
33.45 |
$9,500.00 |
$9,000.00 |
$13,611.00 |
$2,595.00 |
$100,000.00 |
65 |
$3.82 |
$1,333,860.00 |
|
2019 |
340 |
91 |
26.76 |
$10,995.00 |
$10,500.00 |
$17,636.00 |
$2,500.00 |
$90,000.00 |
68 |
$4.42 |
$1,604,905.00 |
|
2020 |
310 |
115 |
37.1 |
$10,000.00 |
$10,000.00 |
$14,067.00 |
$2,500.00 |
$95,000.00 |
48 |
$3.69 |
$1,617,716.00 |
|
2021 |
220 |
93 |
42.27 |
$12,750.00 |
$12,500.00 |
$22,636.00 |
$3,750.00 |
$250,000.00 |
48 |
$4.66 |
$2,105,180.00 |
|
2022 |
282 |
106 |
37.59 |
$11,997.00 |
$11,747.00 |
$21,842.00 |
$2,900.00 |
$300,000.00 |
53 |
$5.04 |
$2,315,300.00 |
|
2023 |
346 |
114 |
32.95 |
$13,999.00 |
$13,500.00 |
$18,304.00 |
$2,250.00 |
$70,000.00 |
75 |
$4.71 |
$2,086,665.00 |
|
2024 |
370 |
135 |
36.49 |
$13,500.00 |
$12,500.00 |
$19,393.00 |
$2,000.00 |
$240,000.00 |
63 |
$4.93 |
$2,618,024.00 |
|
2025 |
358 |
109 |
30.45 |
$15,000.00 |
$15,000.00 |
$20,995.00 |
$2,200.00 |
$150,000.00 |
53 |
$5.48 |
$2,288,489.00 |
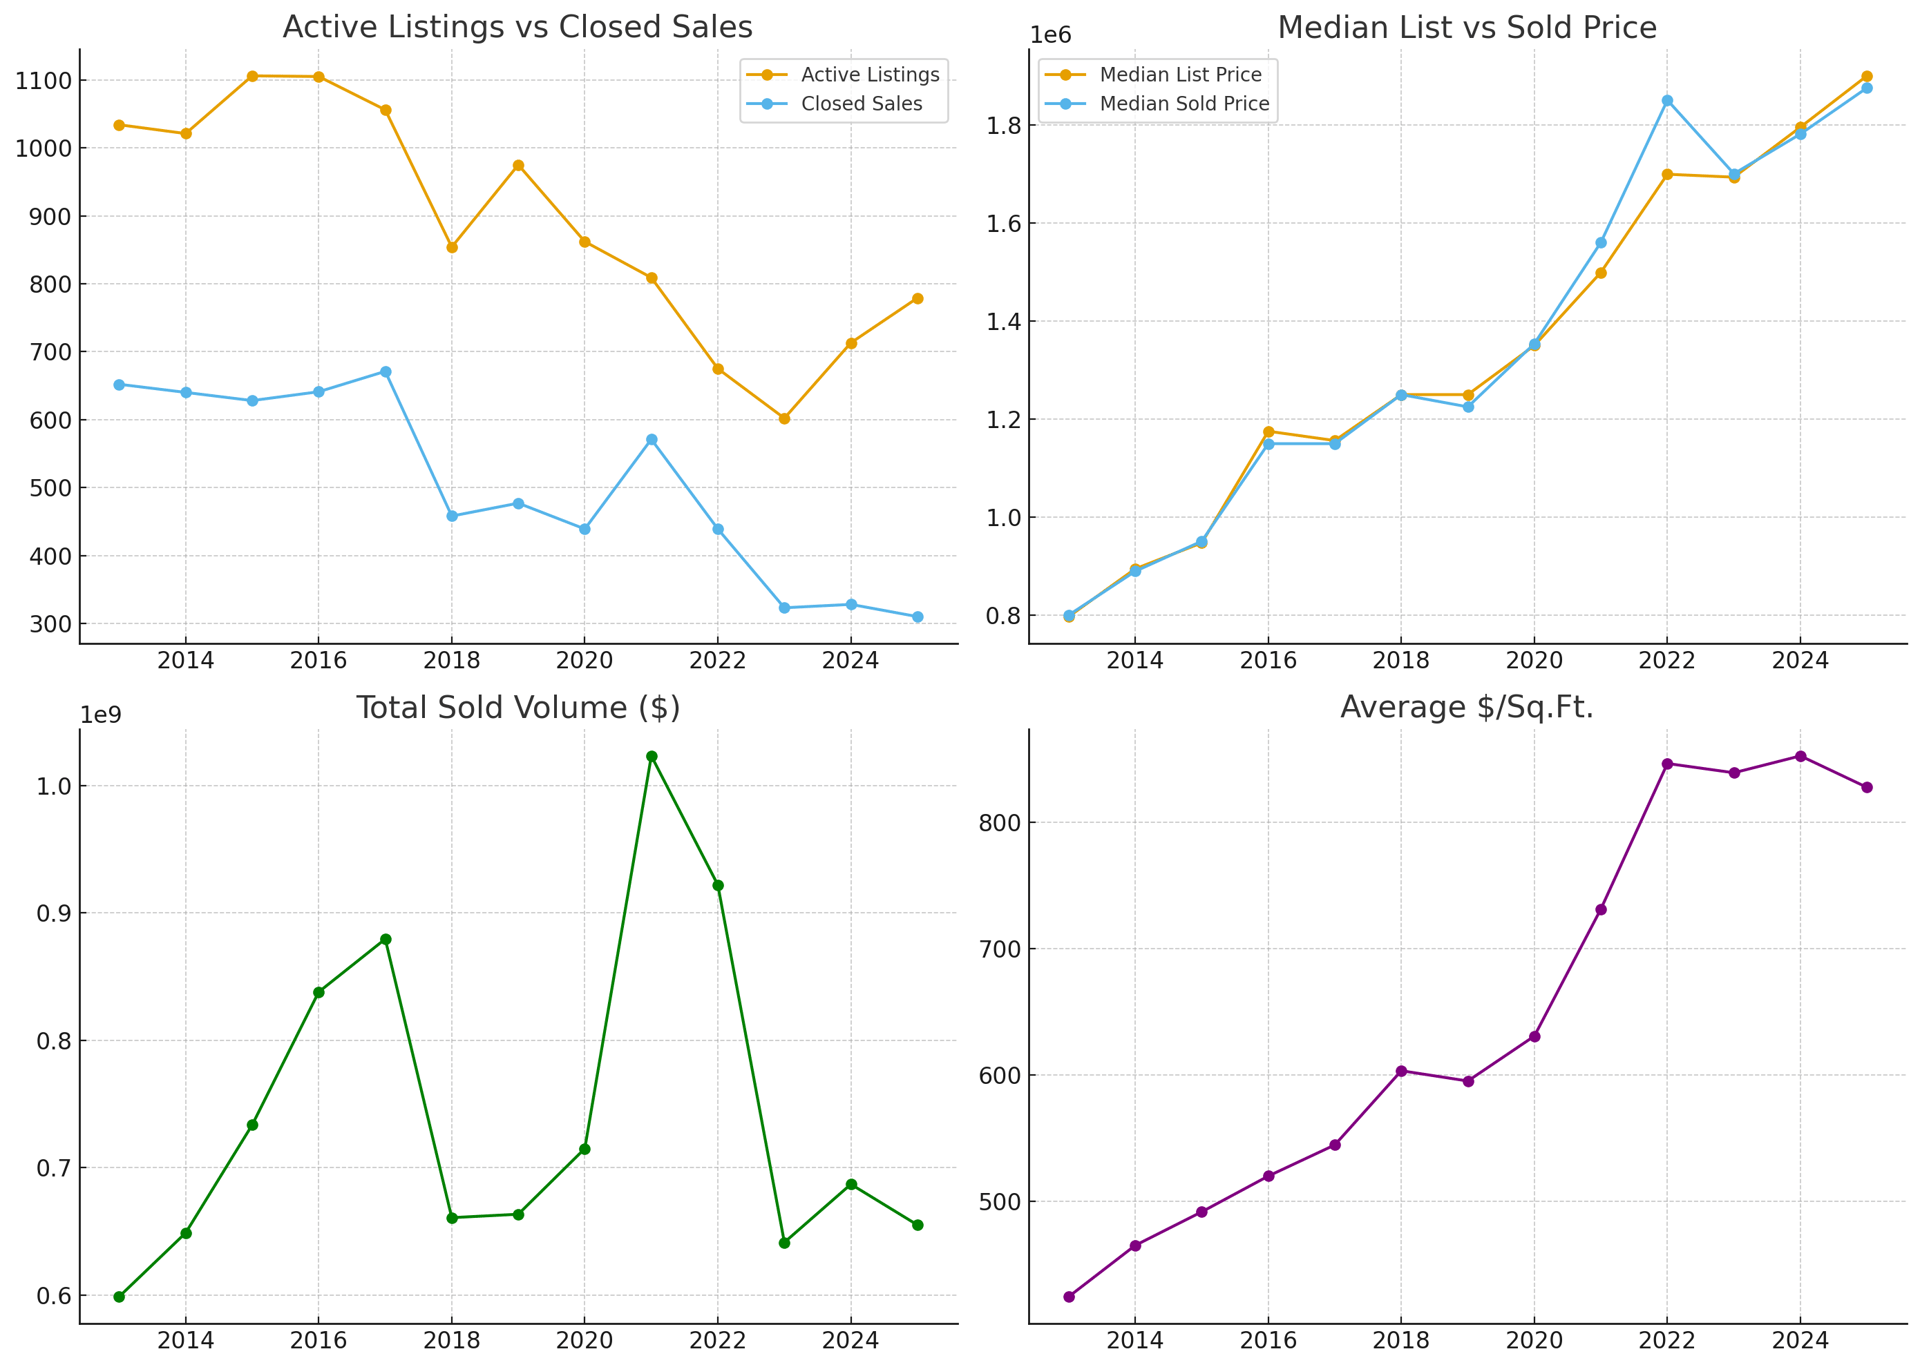
Hollywood Hills West
|
|
|
|
|
|
|
|
|
|
|
|
|
|
|
|
Year |
Active Listings |
Closed Sales |
Closure Rate |
Median List Price |
Median Sold Price |
Min Price Sold |
Max Price Sold |
Average List Price |
Average Sold Price |
DOM Closedl |
Avg $/Sq.Ft. |
|
Total Sold Volume |
|
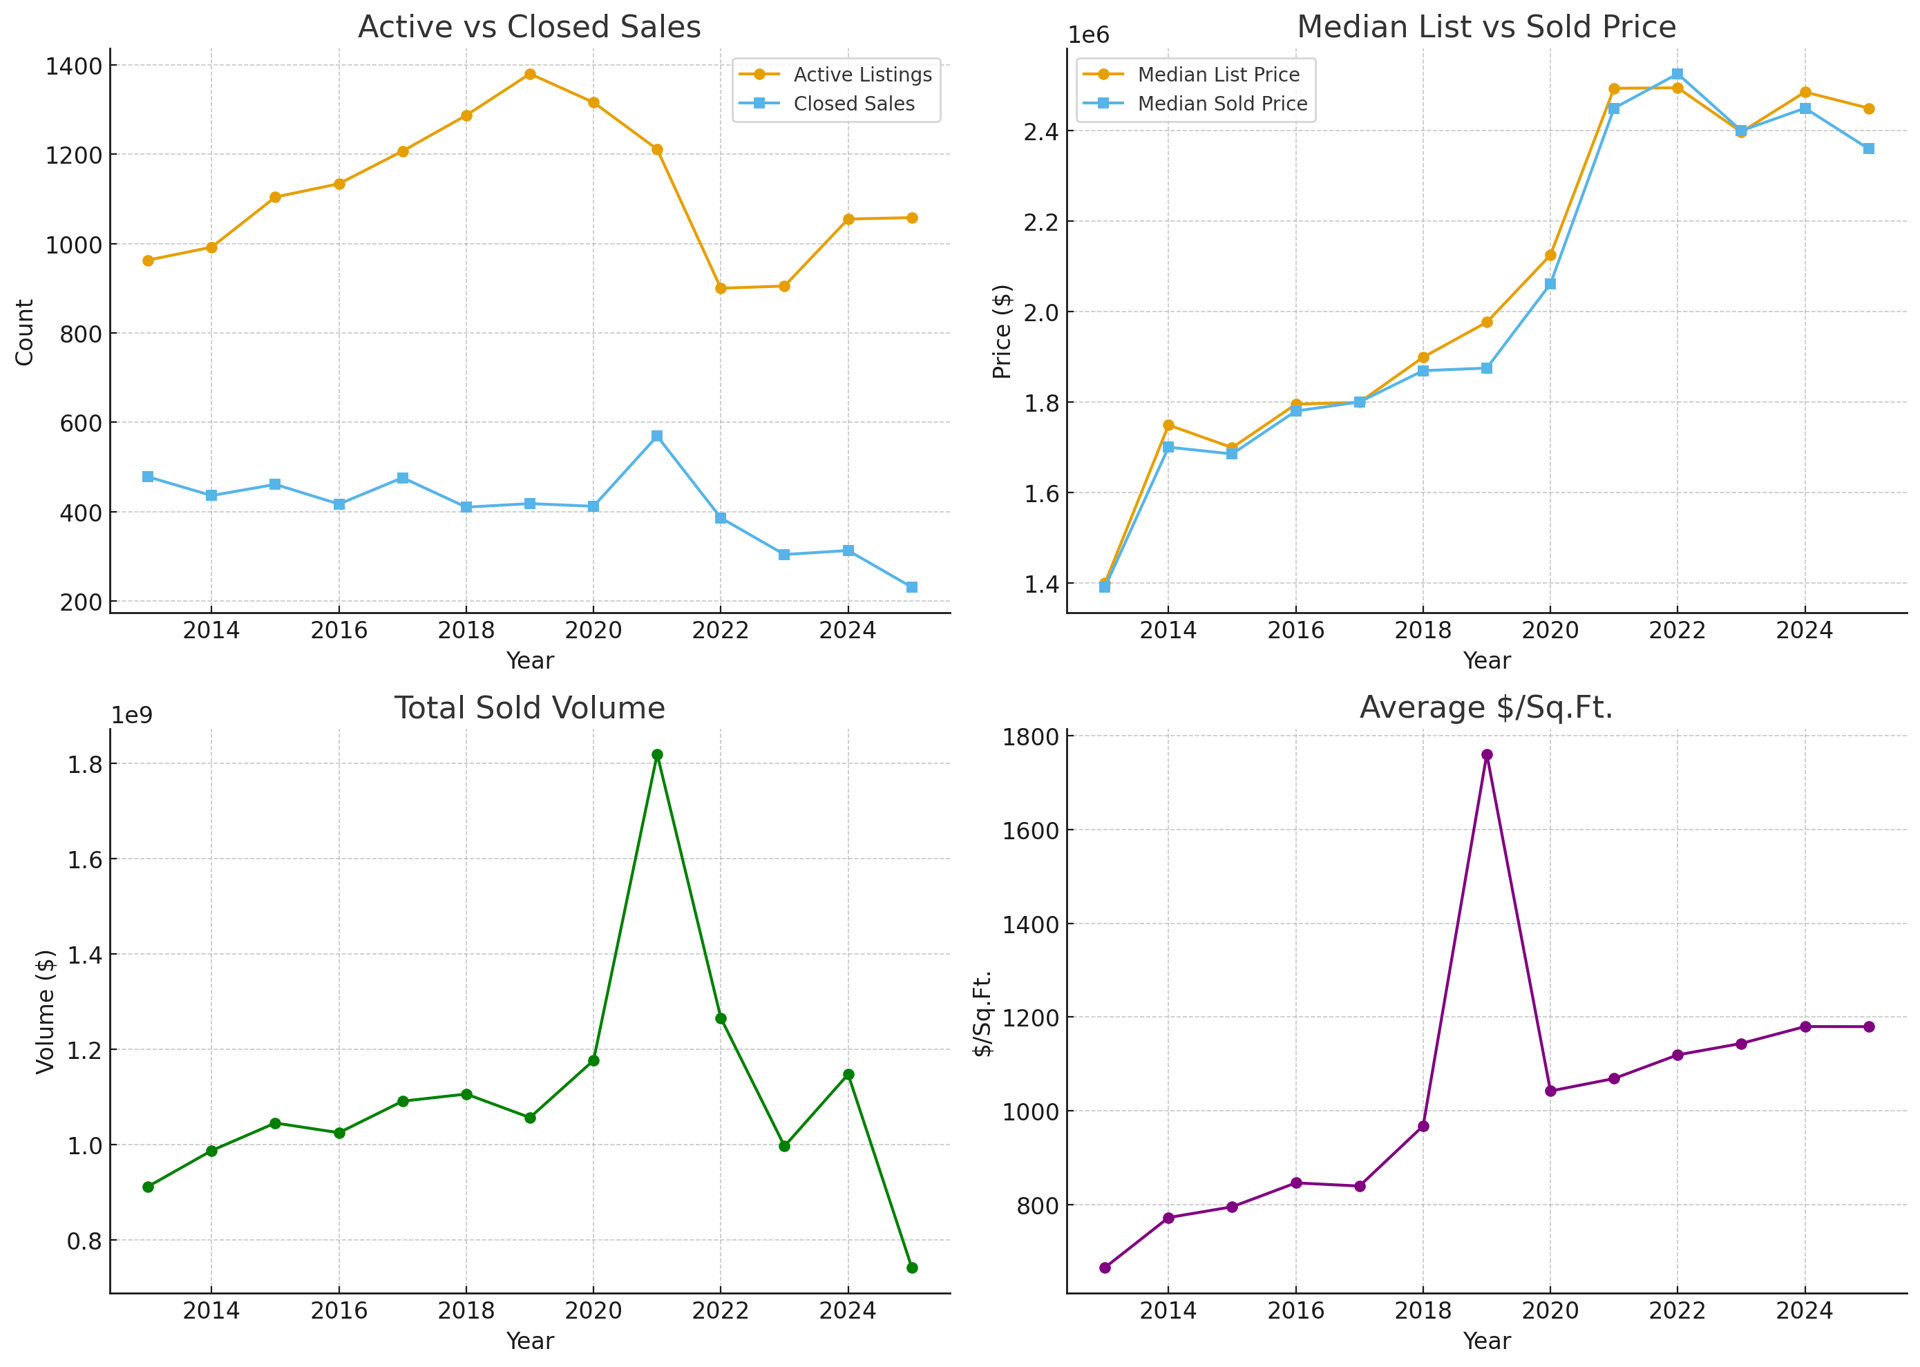
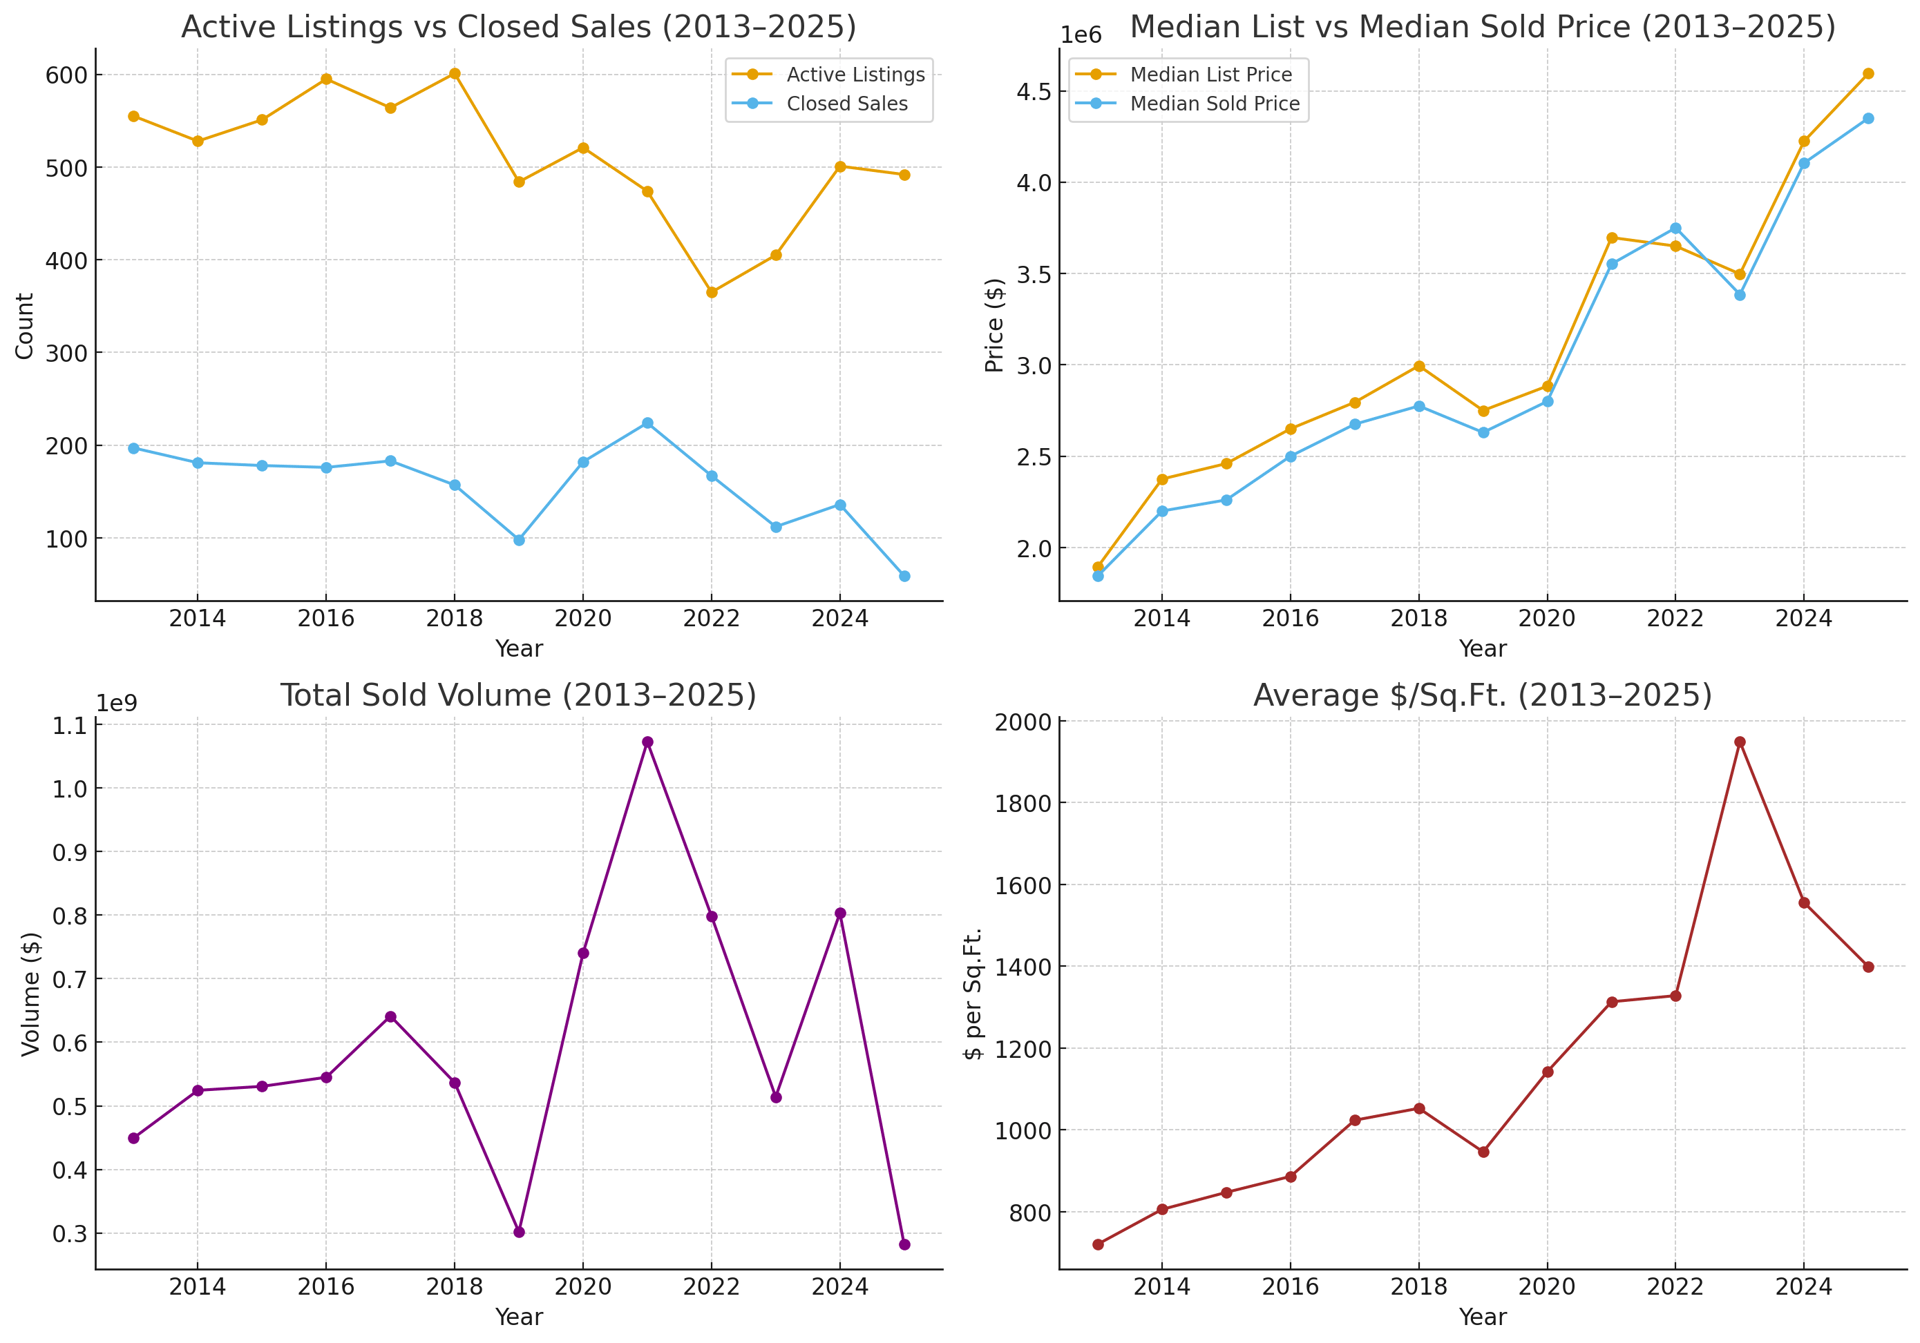
2013 |
963 |
478 |
49.6% |
$1,399,000.00 |
$1,390,350.00 |
$400,000.00 |
$20,000,000.00 |
$1,984,067.00 |
$1,907,593.00 |
75 |
$665.55 |
|
$911,829,560.00 |
|
2014 |
992 |
436 |
44.0% |
$1,749,000.00 |
$1,700,000.00 |
$220,000.00 |
$23,980,000.00 |
$2,355,346.00 |
$2,264,357.00 |
82 |
$772.18 |
|
$987,259,492.00 |
|
2015 |
1104 |
461 |
41.8% |
$1,699,000.00 |
$1,685,000.00 |
$465,000.00 |
$32,000,000.00 |
$2,536,495.00 |
$2,266,896.00 |
71 |
$795.19 |
|
$1,045,038,915.00 |
|
2016 |
1134 |
417 |
36.8% |
$1,795,000.00 |
$1,780,000.00 |
$475,000.00 |
$27,000,000.00 |
$2,559,708.00 |
$2,457,250.00 |
75 |
$846.18 |
|
$1,024,673,191.00 |
|
2017 |
1207 |
476 |
39.4% |
$1,799,249.00 |
$1,800,000.00 |
$200,000.00 |
$32,500,000.00 |
$2,362,016.00 |
$2,291,710.00 |
68 |
$839.43 |
|
$1,090,853,883.00 |
|
2018 |
1,287 |
410 |
31.9% |
$1,899,000.00 |
$1,869,250.00 |
$430,000.00 |
$33,000,000.00 |
$2,817,090.00 |
$2,696,994.00 |
71 |
$967.77 |
|
$1,105,767,497.00 |
|
2019 |
1,380 |
418 |
30.3% |
$1,976,500.00 |
$1,875,000.00 |
$658,000.00 |
$35,500,000.00 |
$2,699,315.00 |
$2,527,372.00 |
67 |
$1,761.02 |
|
$1,056,441,563.00 |
|
2020 |
1,316 |
412 |
31.3% |
$2,125,000.00 |
$2,061,254.00 |
$580,000.00 |
$42,508,888.00 |
$3,047,333.00 |
$2,855,011.00 |
49 |
$1,042.26 |
|
$1,176,264,414.00 |
|
2021 |
1,211 |
569 |
47.0% |
$2,493,999.00 |
$2,450,000.00 |
$650,000.00 |
$26,000,000.00 |
$3,317,671.00 |
$3,195,719.00 |
52 |
$1,068.88 |
|
$1,818,364,310.00 |
|
2022 |
900 |
386 |
42.9% |
$2,495,000.00 |
$2,526,000.00 |
$795,000.00 |
$70,000,000.00 |
$3,367,185.00 |
$3,277,856.00 |
44 |
$1,119.36 |
|
$1,265,252,568.00 |
|
2023 |
905 |
304 |
33.6% |
$2,397,250.00 |
$2,400,000.00 |
$550,000.00 |
$37,440,000.00 |
$3,482,804.00 |
$3,277,591.00 |
44 |
$1,143.78 |
|
$996,387,655.00 |
|
2024 |
1,055 |
313 |
29.7% |
$2,485,666.00 |
$2,450,000.00 |
$810,000.00 |
$62,800,000.00 |
$3,934,944.00 |
$3,665,008.00 |
50 |
$1,179.79 |
|
$1,147,147,623.00 |
|
2025 |
1,058 |
231 |
21.8% |
$2,450,000.00 |
$2,360,000.00 |
$495,000.00 |
$29,500,000.00 |
$3,477,254.00 |
$3,212,113.00 |
48 |
$1,179.55 |
|
$741,998,164.00 |
Hollywood Hills East
|
Year |
Active Listings |
Closed Leases |
Closure Rate (%) |
Median List Price ($) |
Median Leased Price ($) |
Average Lease Price ($) |
Min Price ($) |
Max Price ($) |
Avg Days to Lease |
Avg $/Sq.Ft. |
Total Leased Volume ($) |
|
2013 |
158 |
104 |
65.82 |
$4,250.00 |
$4,225.00 |
$5,472.00 |
$850.00 |
$42,000.00 |
43 |
2.49 |
$569,119.00 |
|
2014 |
154 |
94 |
61.04 |
$4,874.00 |
$4,874.00 |
$13,907.00 |
$1,675.00 |
$11,000.00 |
41 |
2.62 |
$479,283.00 |
|
2015 |
184 |
93 |
50.54 |
$4,750.00 |
$4,750.00 |
$5,620.00 |
$1,500.00 |
$55,000.00 |
43 |
2.84 |
$522,670.00 |
|
2016 |
215 |
116 |
53.95 |
$5,100.00 |
$5,100.00 |
$5,694.00 |
$950.00 |
$15,000.00 |
49 |
3.0 |
$660,470.00 |
|
2017 |
226 |
111 |
49.12 |
$5,200.00 |
$5,200.00 |
$7,539.00 |
$1,500.00 |
$85,000.00 |
52 |
3.73 |
$836,784.00 |
|
2018 |
270 |
129 |
47.78 |
$5,500.00 |
$5,500.00 |
$30,181.00 |
$1,475.00 |
$31,500.00 |
51 |
3.36 |
$924,868.00 |
|
2019 |
306 |
133 |
43.46 |
$5,750.00 |
$5,750.00 |
$6,637.00 |
$1,500.00 |
$22,500.00 |
52 |
3.33 |
$882,686.00 |
|
2020 |
306 |
141 |
46.08 |
$5,750.00 |
$5,750.00 |
$7,385.00 |
$1,595.00 |
$49,500.00 |
36 |
3.38 |
$1,041,322.00 |
|
2021 |
198 |
125 |
63.13 |
$5,800.00 |
$6,800.00 |
$8,887.00 |
$1,500.00 |
$49,500.00 |
49 |
3.45 |
$1,035,850.00 |
|
2022 |
284 |
124 |
43.66 |
$7,000.00 |
$7,450.00 |
$9,623.00 |
$2,250.00 |
$64,000.00 |
58 |
3.91 |
$1,193,214.00 |
|
2023 |
303 |
138 |
45.54 |
$6,500.00 |
$6,500.00 |
$7,728.00 |
$1,195.00 |
$35,988.00 |
53 |
3.97 |
$1,066,476.00 |
|
2024 |
283 |
118 |
41.7 |
$6,997.00 |
$7,000.00 |
$8,614.00 |
$1,650.00 |
$37,500.00 |
55 |
3.96 |
$1,016,485.00 |
|
2025 |
124 |
124 |
43.66 |
$7,450.00 |
$7,450.00 |
$9,623.00 |
$2,250.00 |
$64,000.00 |
58 |
3.91 |
$1,193,214.00 |
West Hollywood
|
Year |
Active Listings |
Closed Leases |
Closure Rate (%) |
Median List Price ($) |
Median Leased Price ($) |
Average Lease Price ($) |
Minimum Price ($) |
Maximum Price ($) |
DOM to Close |
Avg Price per Sq.Ft. ($) |
Total Leased Volume ($) |
|
2013 |
639 |
394 |
61.66% |
$3,200.00 |
$3,199.00 |
$4,723.00 |
$1,050.00 |
$29,995.00 |
42 |
$3.73 |
$1,475,857.00 |
|
2014 |
696 |
402 |
57.76% |
$3,500.00 |
$3,500.00 |
$4,101.00 |
$1,350.00 |
$27,000.00 |
33 |
$3.26 |
$1,648,671.00 |
|
2015 |
804 |
487 |
60.57% |
$3,750.00 |
$3,750.00 |
$4,318.00 |
$1,250.00 |
$28,500.00 |
35 |
$3.23 |
$2,103,025.00 |
|
2016 |
911 |
493 |
54.11% |
$3,900.00 |
$3,850.00 |
$4,572.00 |
$1,250.00 |
$35,000.00 |
41 |
$3.43 |
$2,253,571.00 |
|
2017 |
1,064 |
539 |
50.66% |
$4,000.00 |
$4,000.00 |
$6,598.00 |
$1,550.00 |
$37,000.00 |
47 |
$5.08 |
$2,705,822.00 |
|
2018 |
1,239 |
592 |
47.78% |
$4,000.00 |
$4,000.00 |
$5,039.00 |
$1,599.00 |
$40,000.00 |
39 |
$3.64 |
$2,982,865.00 |
|
2019 |
1,375 |
610 |
44.36% |
$4,200.00 |
$4,200.00 |
$5,733.00 |
$1,350.00 |
$30,000.00 |
46 |
$4.42 |
$3,247,130.00 |
|
2020 |
1,752 |
732 |
41.78% |
$3,949.00 |
$3,900.00 |
$5,023.00 |
$1,295.00 |
$60,000.00 |
37 |
$3.67 |
$3,677,018.00 |
|
2021 |
1,656 |
878 |
53.05% |
$3,995.00 |
$3,995.00 |
$5,505.00 |
$1,200.00 |
$75,000.00 |
53 |
$3.78 |
$4,833,568.00 |
|
2022 |
1,265 |
728 |
57.54% |
$4,614.00 |
$4,625.00 |
$6,008.00 |
$1,000.00 |
$43,000.00 |
39 |
$4.29 |
$4,374,088.00 |
|
2023 |
1,612 |
815 |
50.56% |
$4,871.00 |
$4,850.00 |
$6,114.00 |
$1,650.00 |
$45,000.00 |
48 |
$4.36 |
$4,983,291.00 |
|
2024 |
1,826 |
897 |
49.12% |
$4,867.00 |
$4,800.00 |
$6,293.00 |
$1,500.00 |
$64,000.00 |
59 |
$4.39 |
$5,644,992.00 |
|
2025 |
1,585 |
772 |
48.69% |
$4,840.00 |
$4,800.00 |
$6,577.00 |
$1,350.00 |
$66,000.00 |
45 |
$4.50 |
$5,077,732.00 |
Brentwood
|
Year |
Active Listings |
Closed Leases |
Closure Rate (%) |
Median List Price ($) |
Median Leased Price ($) |
Average Lease Price ($) |
Min Price ($) |
Max Price ($) |
Avg Days to Lease |
Avg $/Sq.Ft. |
Total Leased Volume ($) |
|
|
2013 |
434 |
247 |
56.91% |
$4,500.00 |
$4,450.00 |
$6,227.00 |
$1,375.00 |
$50,000.00 |
43 |
$2.74 |
$1,538,169.00 |
|
|
2014 |
505 |
287 |
56.83% |
$4,298.00 |
$4,295.00 |
$12,991.00 |
$975.00 |
$37,000.00 |
49 |
$2.88 |
$3,728,425.00 |
|
|
2015 |
550 |
305 |
55.45% |
$4,950.00 |
$4,900.00 |
$6,521.00 |
$1,400.00 |
$60,000.00 |
38 |
$2.92 |
$1,988,823.00 |
|
|
2016 |
573 |
310 |
54.1% |
$4,850.00 |
$4,775.00 |
$6,849.00 |
$1,500.00 |
$66,500.00 |
46 |
$3.03 |
$2,123,278.00 |
|
|
2017 |
599 |
294 |
49.08% |
$5,000.00 |
$5,000.00 |
$6,987.00 |
$1,799.00 |
$50,000.00 |
47 |
$3.05 |
$2,054,151.00 |
|
|
2018 |
688 |
346 |
50.29% |
$5,900.00 |
$5,872.00 |
$9,537.00 |
$1,700.00 |
$40,000.00 |
46 |
$3.33 |
$2,600,728.00 |
|
|
2019 |
680 |
352 |
51.76% |
$5,464.00 |
$5,470.00 |
$7,667.00 |
$1,595.00 |
$48,000.00 |
46 |
$3.38 |
$2,698,804.00 |
|
|
2020 |
862 |
343 |
39.79% |
$5,498.00 |
$5,500.00 |
$7,785.00 |
$1,550.00 |
$65,000.00 |
35 |
$3.33 |
$2,670,281.00 |
|
|
2021 |
808 |
403 |
49.88% |
$5,030.00 |
$5,000.00 |
$7,987.00 |
$1,650.00 |
$85,000.00 |
46 |
$3.50 |
$3,218,771.00 |
|
|
2022 |
594 |
337 |
56.73% |
$6,233.00 |
$6,200.00 |
$9,715.00 |
$2,000.00 |
$62,500.00 |
38 |
$3.98 |
$3,273,838.00 |
|
|
2023 |
686 |
410 |
59.77% |
$6,295.00 |
$6,295.00 |
$15,867.00 |
$1,995.00 |
$200,000.00 |
46 |
$4.54 |
$4,305,463.00 |
|
|
2024 |
743 |
394 |
53.03% |
$6,204.00 |
$6,097.00 |
$8,996.00 |
$1,795.00 |
$150,000.00 |
47 |
$4.12 |
$3,544,298.00 |
|
|
2025 |
692 |
402 |
58.09% |
$6,172.00 |
$6,200.00 |
$12,648.00 |
$2,000.00 |
$150,000.00 |
37 |
$4.81 |
$5,084,691.00 |
|
Santa Monica
|
Year |
Active Listings |
Closed Sales |
Conversion % |
Median List Price |
Median Sold Price |
Min Price Sold |
Max Price Sold |
Avg List Price |
Avg Sold Price |
DOM Closed |
Avg $/Sq.Ft. |
|
Total Sold Volume |
|
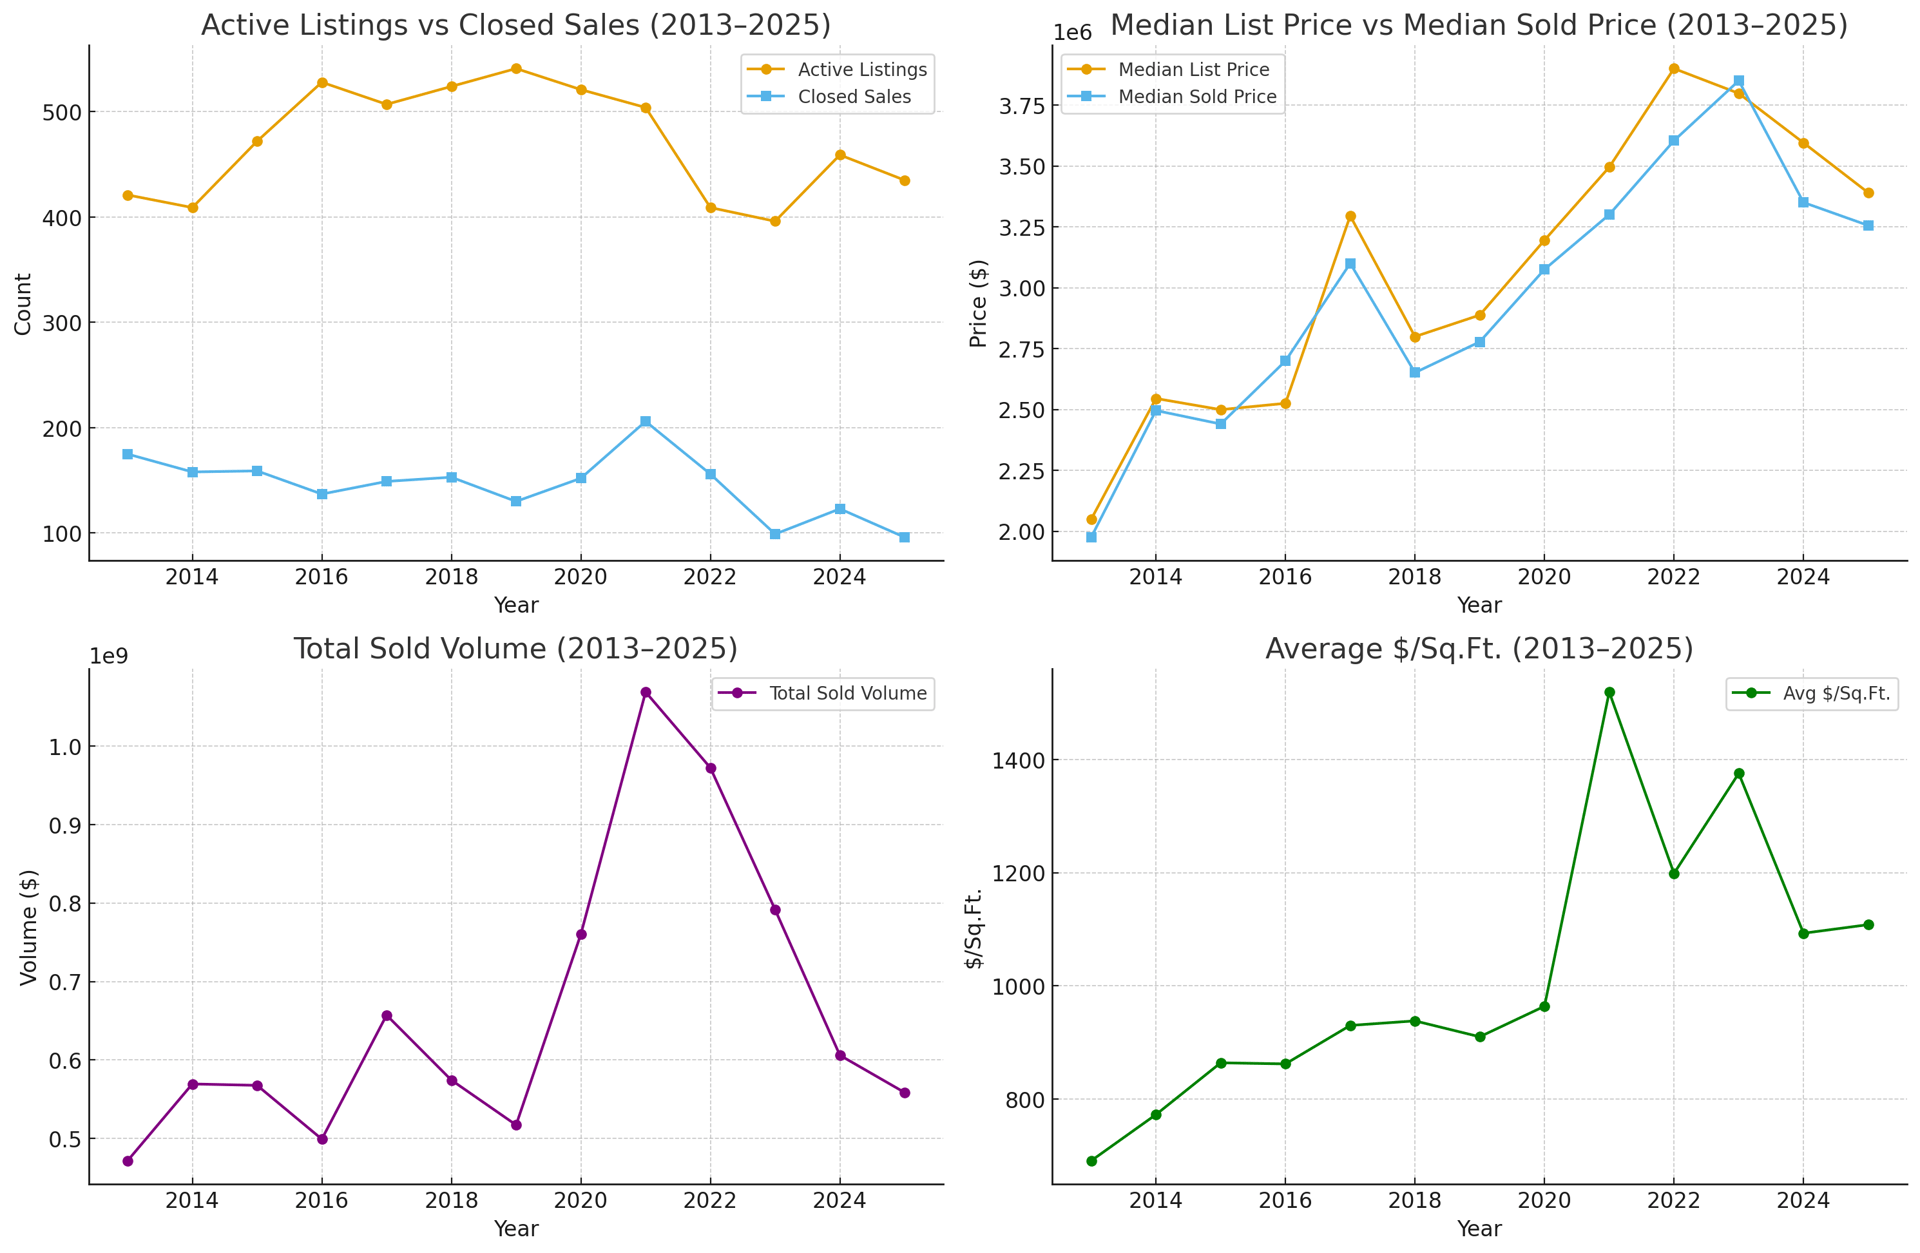
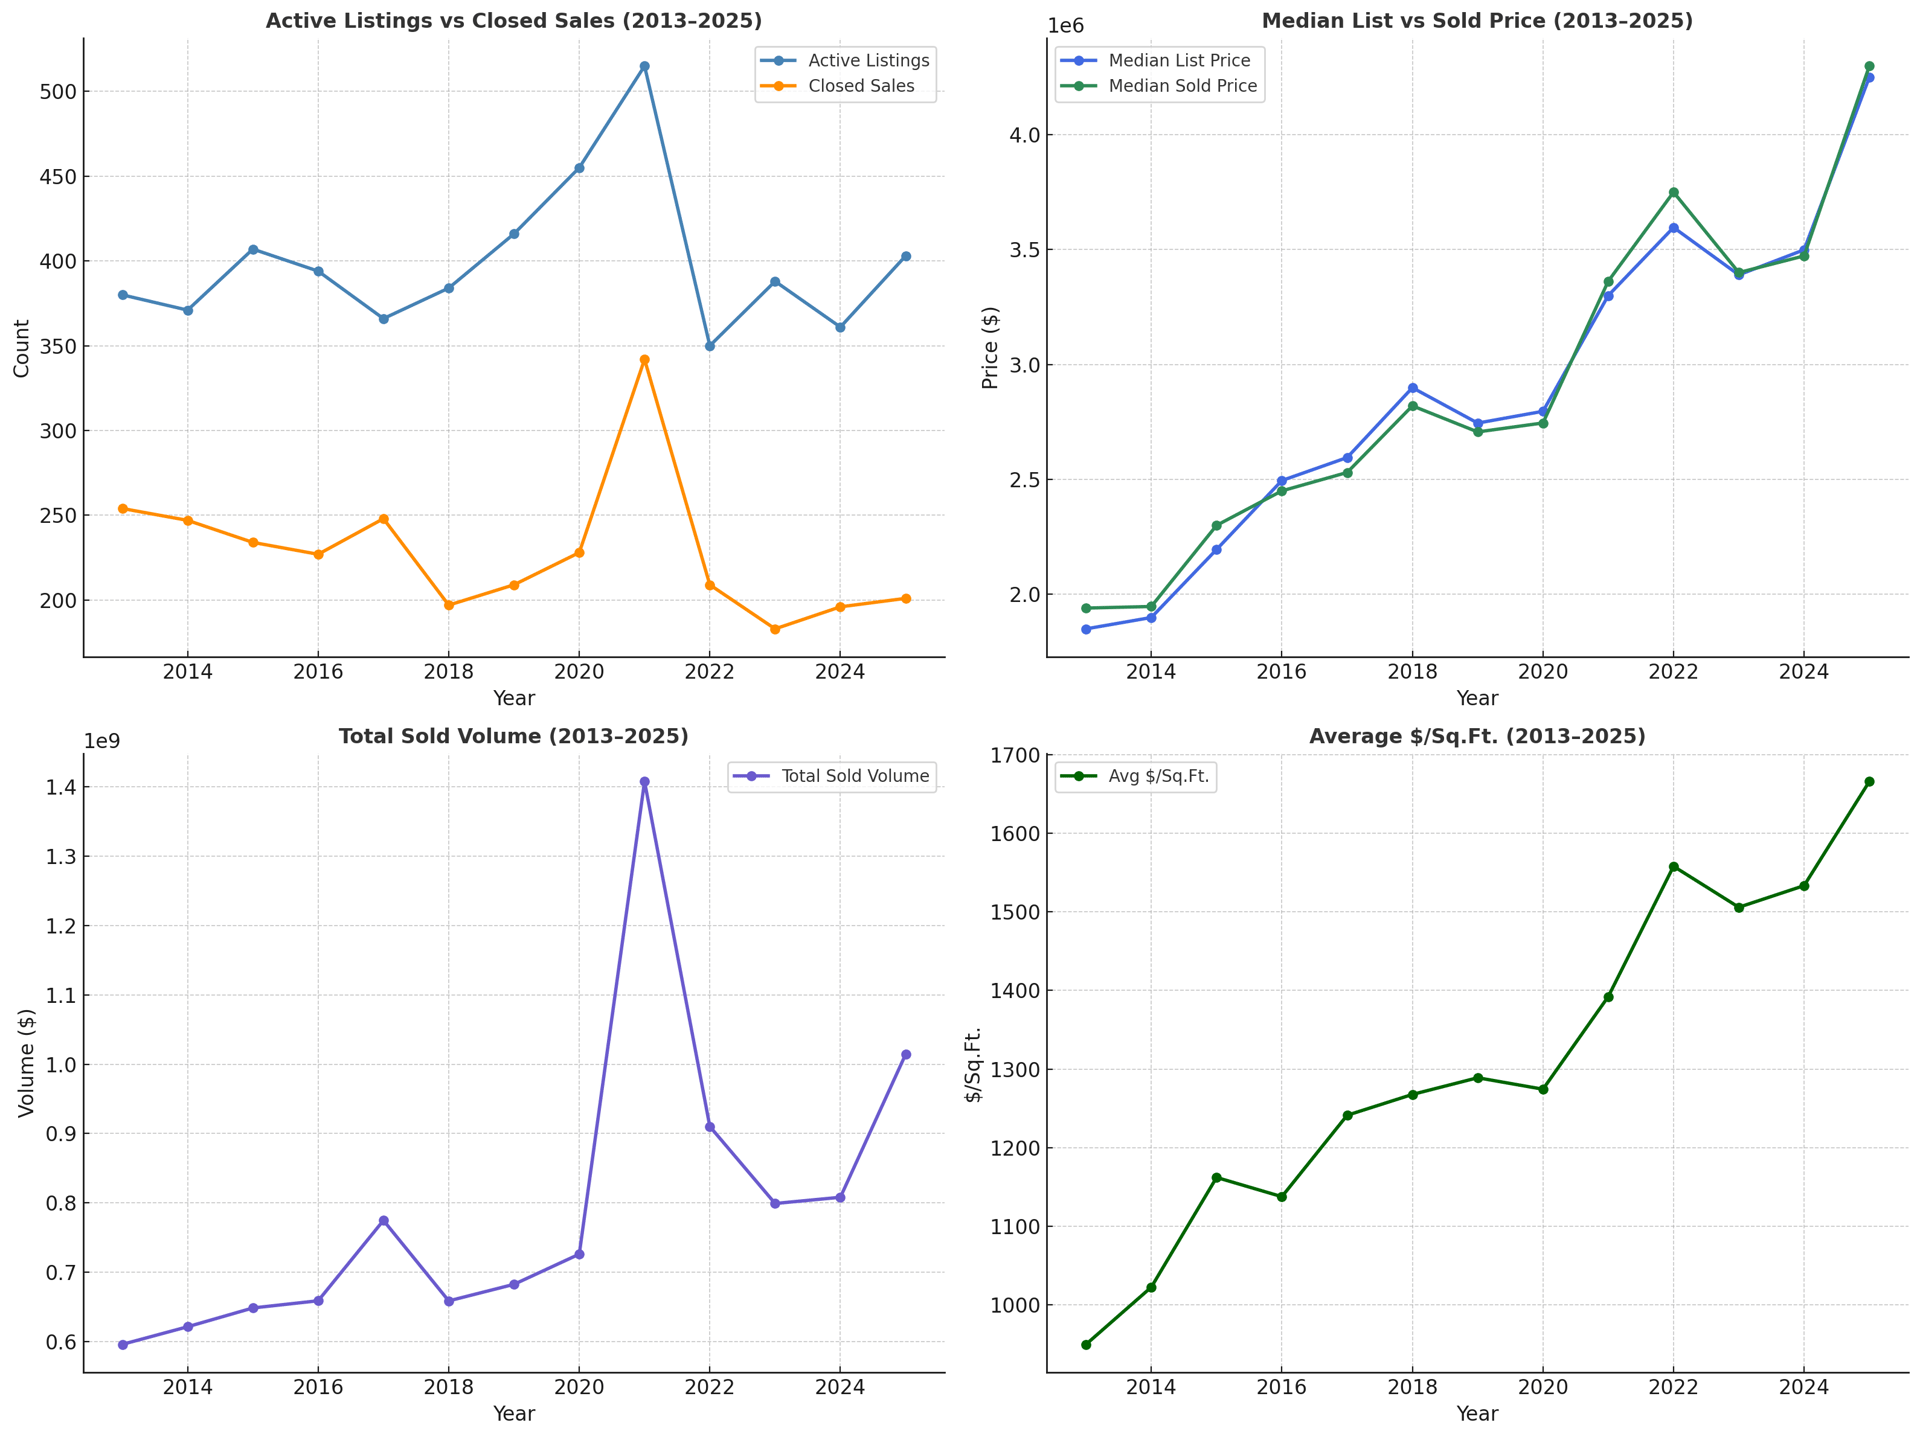
2013 |
380 |
254 |
66.8% |
$1,849,500.00 |
$1,940,000.00 |
$625,000.00 |
$11,500,000.00 |
$2,343,442.00 |
$2,347,794.00 |
54 |
$949.69 |
|
$596,339,580.00 |
|
2014 |
371 |
247 |
66.6% |
$1,899,000.00 |
$1,946,932.00 |
$669,000.00 |
$24,500,000.00 |
$2,529,477.00 |
$2,516,996.00 |
57 |
$1,022.48 |
|
$621,698,117.00 |
|
2015 |
407 |
234 |
57.5% |
$2,195,000.00 |
$2,300,000.00 |
$762,000.00 |
$23,000,000.00 |
$2,788,513.00 |
$2,772,521.00 |
44 |
$1,162.07 |
|
$648,769,915.00 |
|
2016 |
394 |
227 |
57.6% |
$2,495,000.00 |
$2,450,000.00 |
$500,000.00 |
$16,100,000.00 |
$2,944,919.00 |
$2,903,706.00 |
50 |
$1,137.63 |
|
$659,141,358.00 |
|
2017 |
366 |
248 |
67.8% |
$2,595,000.00 |
$2,530,000.00 |
$800,000.00 |
$11,000,000.00 |
$3,159,726.00 |
$3,124,535.00 |
48 |
$1,241.22 |
|
$774,884,567.00 |
|
2018 |
384 |
197 |
51.3% |
$2,899,000.00 |
$2,820,000.00 |
$975,000.00 |
$11,100,000.00 |
$3,400,451.00 |
$3,344,908.00 |
45 |
$1,267.73 |
|
$658,946,832.00 |
|
2019 |
416 |
209 |
50.2% |
$2,745,000.00 |
$2,706,500.00 |
$835,000.00 |
$16,000,000.00 |
$3,324,619.00 |
$3,266,958.00 |
56 |
$1,288.96 |
|
$682,794,140.00 |
|
2020 |
455 |
228 |
50.1% |
$2,796,333.00 |
$2,745,550.00 |
$725,000.00 |
$18,500,000.00 |
$3,241,826.00 |
$3,185,590.00 |
38 |
$1,274.39 |
|
$726,314,427.00 |
|
2021 |
515 |
342 |
66.4% |
$3,299,944.00 |
$3,362,500.00 |
$1,150,000.00 |
$48,674,649.00 |
$4,107,388.00 |
$4,114,883.00 |
38 |
$1,392.19 |
|
$1,407,290,085.00 |
|
2022 |
350 |
209 |
59.7% |
$3,596,333.00 |
$3,750,000.00 |
$1,000,000.00 |
$19,500,000.00 |
$4,295,840.00 |
$4,355,172.00 |
31 |
$1,558.06 |
|
$910,230,868.00 |
|
2023 |
388 |
183 |
47.2% |
$3,390,000.00 |
$3,400,000.00 |
$1,090,000.00 |
$22,500,000.00 |
$4,504,300.00 |
$4,367,678.00 |
38 |
$1,505.93 |
|
$799,285,137.00 |
|
2024 |
361 |
196 |
54.3% |
$3,499,000.00 |
$3,472,500.00 |
$1,080,000.00 |
$19,150,000.00 |
$4,186,535.00 |
$4,126,672.00 |
31 |
$1,533.43 |
|
$808,227,726.00 |
|
2025 |
403 |
201 |
49.9% |
$4,250,000.00 |
$4,299,000.00 |
$250,000.00 |
$14,550,000.00 |
$4,986,384.00 |
$5,046,207.00 |
32 |
$1,666.01 |
|
$1,014,287,545.00 |
Pacific Palisades
|
Year |
Active Listings |
Closed Sales |
Closure Rate % |
Median List Price |
Median Sold Price |
Min Price Sold |
Max Price Sold |
Avg List Price |
Avg Sold Price |
Avg Days to Sell |
Avg $/Sq.Ft. |
|
Total Sold Volume |
|
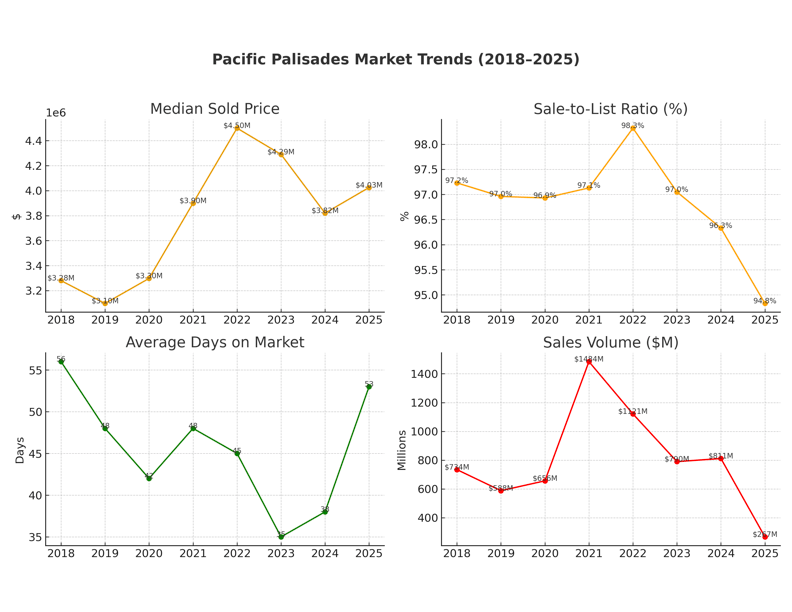
2013 |
513 |
323 |
63.0% |
$2,275,000.00 |
$2,237,500.00 |
$610,000.00 |
$17,500,000.00 |
$2,801,882.00 |
$2,762,117.00 |
70 |
$841.14 |
|
$892,163,872.00 |
|
2014 |
496 |
303 |
61.1% |
$2,495,000.00 |
$2,500,000.00 |
$825,000.00 |
$15,729,188.00 |
$3,250,969.00 |
$3,184,229.00 |
62 |
$916.88 |
|
$964,821,261.00 |
|
2015 |
514 |
289 |
56.2% |
$2,859,000.00 |
$2,814,000.00 |
$1,005,000.00 |
$22,000,000.00 |
$3,498,772.00 |
$3,448,279.00 |
61 |
$1,017.20 |
|
$996,552,629.00 |
|
2016 |
544 |
259 |
47.6% |
$2,878,333.00 |
$2,795,000.00 |
$1,100,000.00 |
$22,375,000.00 |
$3,664,050.00 |
$3,549,080.00 |
63 |
$1,039.10 |
|
$919,211,726.00 |
|
2017 |
466 |
260 |
55.8% |
$3,197,000.00 |
$3,164,576.00 |
$1,350,000.00 |
$22,000,000.00 |
$4,108,561.00 |
$3,990,982.00 |
58 |
$1,125.61 |
|
$1,037,655,225.00 |
|
2018 |
384 |
167 |
43.5 |
$3,288,900.00 |
$3,280,000.00 |
$1,400,000.00 |
$33,850,670.00 |
$5,051,411.00 |
$4,396,691.00 |
56 |
$1,204.21 |
|
$734,247,411.00 |
|
2019 |
441 |
148 |
33.6 |
$3,097,500.00 |
$3,058,750.00 |
$1,500,000.00 |
$21,000,000.00 |
$4,109,317.00 |
$3,973,202.00 |
48 |
$1,181.21 |
|
$588,033,959.00 |
|
2020 |
469 |
166 |
35.4 |
$3,295,000.00 |
$3,297,500.00 |
$1,511,250.00 |
$24,000,000.00 |
$4,078,193.00 |
$3,952,933.00 |
42 |
$1,171.75 |
|
$656,186,904.00 |
|
2021 |
499 |
291 |
58.3 |
$3,985,000.00 |
$3,900,000.00 |
$1,470,000.00 |
$25,500,000.00 |
$5,251,741.00 |
$5,101,175.00 |
48 |
$1,253.39 |
|
$1,484,441,943.00 |
|
2022 |
312 |
182 |
58.3 |
$4,397,000.00 |
$4,500,000.00 |
$1,849,000.00 |
$51,000,000.00 |
$6,263,833.00 |
$6,158,787.00 |
45 |
$1,559.69 |
|
$1,120,899,307.00 |
|
2023 |
381 |
150 |
39.4 |
$4,347,500.00 |
$4,290,000.00 |
$1,800,000.00 |
$24,950,000.00 |
$5,425,206.00 |
$5,264,986.00 |
35 |
$1,525.33 |
|
$789,747,895.00 |
|
2024 |
355 |
151 |
42.5 |
$3,900,000.00 |
$3,820,000.00 |
$1,860,000.00 |
$32,300,000.00 |
$5,577,842.00 |
$5,372,919.00 |
38 |
$1,447.79 |
|
$811,310,842.00 |
|
2025 |
222 |
39 |
17.6 |
$4,199,000.00 |
$4,025,000.00 |
$1,400,000.00 |
$25,750,000.00 |
$7,219,410.00 |
$6,846,286.00 |
53 |
$1,508.26 |
|
$267,005,168.00 |
Malibu
|
Year |
Active Listings |
Closed Leases |
Closure Rate (%) |
Median List Price ($) |
Median Leased Price ($) |
Average Lease Price ($) |
Min Price ($) |
Max Price ($) |
Avg Days to Lease |
Avg $/Sq.Ft. |
Total Leased Volume ($) |
|
2013 |
537 |
265 |
49.35% |
$4,439.00 |
$4,400.00 |
$5,835.00 |
$1,200.00 |
$49,000.00 |
60 |
$2.72 |
$1,546,157.00 |
|
2014 |
450 |
268 |
59.56% |
$5,170.00 |
$5,050.00 |
$7,437.00 |
$1,400.00 |
$50,000.00 |
59 |
$3.08 |
$1,993,028.00 |
|
2015 |
463 |
257 |
55.51% |
$5,700.00 |
$5,600.00 |
$17,963.00 |
$1,695.00 |
$60,000.00 |
53 |
3.72 |
$2,126,393.00 |
|
2016 |
494 |
230 |
46.56% |
$6,500.00 |
$6,500.00 |
$8,457.00 |
$1,495.00 |
$60,000.00 |
60 |
$3.69 |
$1,945,011.00 |
|
2017 |
584 |
274 |
46.92% |
$6,000.00 |
$6,000.00 |
$10,148.00 |
$1,550.00 |
$90,000.00 |
78 |
$3.78 |
$2,485,435.00 |
|
2018 |
691 |
295 |
42.69% |
$6,908.00 |
$6,800.00 |
$10,390.00 |
$1,325.00 |
$157,500.00 |
70 |
$4.16 |
$3,065,099.00 |
|
2019 |
673 |
269 |
39.97% |
$7,224.00 |
$6,590.00 |
$10,823.00 |
$1,595.00 |
$110,000.00 |
65 |
$4.42 |
$2,911,375.00 |
|
2020 |
588 |
256 |
43.54% |
$6,200.00 |
$6,447.00 |
$11,334.00 |
$1,695.00 |
$280,000.00 |
48 |
$4.41 |
$2,901,530.00 |
|
2021 |
463 |
234 |
50.54% |
$7,472.00 |
$7,500.00 |
$13,310.00 |
$1,895.00 |
$90,000.00 |
57 |
$5.51 |
$3,114,545.00 |
|
2022 |
704 |
256 |
36.36% |
$9,500.00 |
$9,000.00 |
$12,725.00 |
$2,095.00 |
$90,000.00 |
66 |
$5.63 |
$3,257,934.00 |
|
2023 |
699 |
249 |
35.62% |
$8,000.00 |
$8,000.00 |
$11,727.00 |
$1,795.00 |
$85,000.00 |
80 |
$5.62 |
$2,920,147.00 |
|
2024 |
683 |
189 |
27.67% |
$8,950.00 |
$8,950.00 |
$12,937.00 |
$1,795.00 |
$60,000.00 |
68 |
$6.14 |
$2,445,015.00 |
|
2025 |
726 |
245 |
33.75% |
$9,550.00 |
$9,000.00 |
$13,965.00 |
$1,895.00 |
$99,000.00 |
64 |
$6.67 |
$3,410,925.00 |
Malibu Beach
|
Year |
Active Listings |
Closed Leases |
Closure Rate (%) |
Median List Price ($) |
Median Leased Price ($) |
Average Lease Price ($) |
Min Price ($) |
Max Price ($) |
Avg Days to Lease |
Avg $/Sq.Ft. |
Total Leased Volume ($) |
|
|
2013 |
436 |
228 |
52.29 |
$5,500.00 |
$5,200.00 |
$7,450.00 |
$1,800.00 |
$60,000.00 |
58 |
$3.25 |
$1,700,000.00 |
|
|
2014 |
403 |
240 |
59.55 |
$5,500.00 |
$5,300.00 |
$7,600.00 |
$2,000.00 |
$70,000.00 |
55 |
$3.40 |
$1,825,000.00 |
|
|
2015 |
438 |
222 |
50.68 |
$6,000.00 |
$5,700.00 |
$8,500.00 |
$2,000.00 |
$95,000.00 |
60 |
$3.75 |
$1,887,000.00 |
|
|
2016 |
462 |
215 |
46.54 |
$6,500.00 |
$6,000.00 |
$8,750.00 |
$2,200.00 |
$120,000.00 |
63 |
$3.90 |
$1,902,000.00 |
|
|
2017 |
516 |
232 |
44.96 |
$6,500.00 |
$6,000.00 |
$8,800.00 |
$2,400.00 |
$150,000.00 |
70 |
$4.05 |
$2,040,000.00 |
|
|
2018 |
567 |
249 |
43.92 |
$7,000.00 |
$6,500.00 |
$9,200.00 |
$2,500.00 |
$180,000.00 |
68 |
$4.20 |
$2,290,000.00 |
|
|
2019 |
605 |
241 |
39.83 |
$7,250.00 |
$6,750.00 |
$9,500.00 |
$2,600.00 |
$200,000.00 |
72 |
$4.35 |
$2,295,000.00 |
|
|
2020 |
578 |
227 |
39.27 |
$6,900.00 |
$6,500.00 |
$9,400.00 |
$2,700.00 |
$250,000.00 |
66 |
$4.50 |
$2,130,000.00 |
|
|
2021 |
489 |
210 |
42.94 |
$7,950.00 |
$7,500.00 |
$11,000.00 |
$3,000.00 |
$280,000.00 |
62 |
$4.85 |
$2,310,000.00 |
|
|
2022 |
621 |
213 |
34.3 |
$9,500.00 |
$9,000.00 |
$12,250.00 |
$3,500.00 |
$300,000.00 |
64 |
$5.20 |
$2,560,000.00 |
|
|
2023 |
688 |
189 |
27.47 |
$9,000.00 |
$8,700.00 |
$11,800.00 |
$4,000.00 |
$250,000.00 |
70 |
$5.10 |
$2,230,000.00 |
|
|
2024 |
673 |
178 |
26.45 |
$9,200.00 |
$8,800.00 |
$12,000.00 |
$4,000.00 |
$275,000.00 |
73 |
$5.30 |
$2,275,000.00 |
|
|
2025 |
624 |
193 |
30.93 |
$9,500.00 |
$9,100.00 |
$12,400.00 |
$4,200.00 |
$300,000.00 |
68 |
$5.50 |
$2,395,000.00 |
|
Beverlywood
|
Year |
Active Listings |
Closed Leases |
Closure Rate (%) |
Median List Price ($) |
Median Leased Price ($) |
Average Lease Price ($) |
Minimum Price ($) |
Maximum Price ($) |
DOM to close |
Avg Price per Sq.Ft ($) |
Total Leased Volume ($) |
|
2013 |
155 |
88 |
56.77 |
$3,395.00 |
$3,297.00 |
$3,532.00 |
$1,150.00 |
$9,500.00 |
37 |
2.06 |
$310,778.00 |
|
2014 |
221 |
133 |
60.18 |
$3,500.00 |
$3,495.00 |
$4,953.00 |
$1,350.00 |
$15,900.00 |
39 |
2.2 |
$478,764.00 |
|
2015 |
214 |
113 |
52.8 |
$3,800.00 |
$3,800.00 |
$4,522.00 |
$1,299.00 |
$10,000.00 |
42 |
6.81 |
$463,311.00 |
|
2016 |
270 |
147 |
54.44 |
$3,850.00 |
$3,850.00 |
$4,251.00 |
$1,500.00 |
$10,500.00 |
39 |
2.48 |
$624,876.00 |
|
2017 |
252 |
128 |
50.79 |
$3,785.00 |
$3,700.00 |
$4,142.00 |
$1,525.00 |
$15,000.00 |
45 |
2.52 |
$530,188.00 |
|
2018 |
335 |
165 |
49.25 |
$3,950.00 |
$3,900.00 |
$4,366.00 |
$1,595.00 |
$21,800.00 |
40 |
23.97 |
$720,406.00 |
|
2019 |
403 |
183 |
45.41 |
$4,300.00 |
$4,200.00 |
$4,694.00 |
$1,725.00 |
$28,500.00 |
40 |
7.71 |
$926,108.00 |
|
2020 |
645 |
217 |
33.64 |
$4,200.00 |
$4,100.00 |
$4,989.00 |
$1,690.00 |
$26,000.00 |
33 |
2.86 |
$1,082,542.00 |
|
2021 |
654 |
305 |
46.64 |
$3,800.00 |
$3,795.00 |
$4,801.00 |
$1,145.00 |
$24,000.00 |
52 |
2.98 |
$1,464,286.00 |
|
2022 |
421 |
223 |
52.97 |
$4,250.00 |
$4,250.00 |
$5,279.00 |
$1,450.00 |
$20,000.00 |
38 |
3.42 |
$1,177,165.00 |
|
2023 |
500 |
261 |
52.2 |
$4,490.00 |
$4,400.00 |
$5,550.00 |
$1,495.00 |
$28,500.00 |
50 |
3.33 |
$1,448,476.00 |
|
2024 |
526 |
253 |
48.1 |
$4,431.00 |
$4,395.00 |
$5,597.00 |
$1,395.00 |
$25,000.00 |
50 |
3.47 |
$1,416,105.00 |
|
2025 |
574 |
254 |
44.25 |
$4,295.00 |
$4,297.00 |
$5,466.00 |
$1,400.00 |
$40,000.00 |
47 |
3.64 |
$1,388,251.00 |
Studio City
|
Year |
Active Listings |
Closed Sales |
Closure Rate |
Median List Price |
Median Sold Price |
Min Price Sold |
Max Price Sold |
Avg List Price |
Avg Sold Price |
Avg Days to Sell |
Avg $/Sq.Ft. |
|
Total Sold Volume |
|
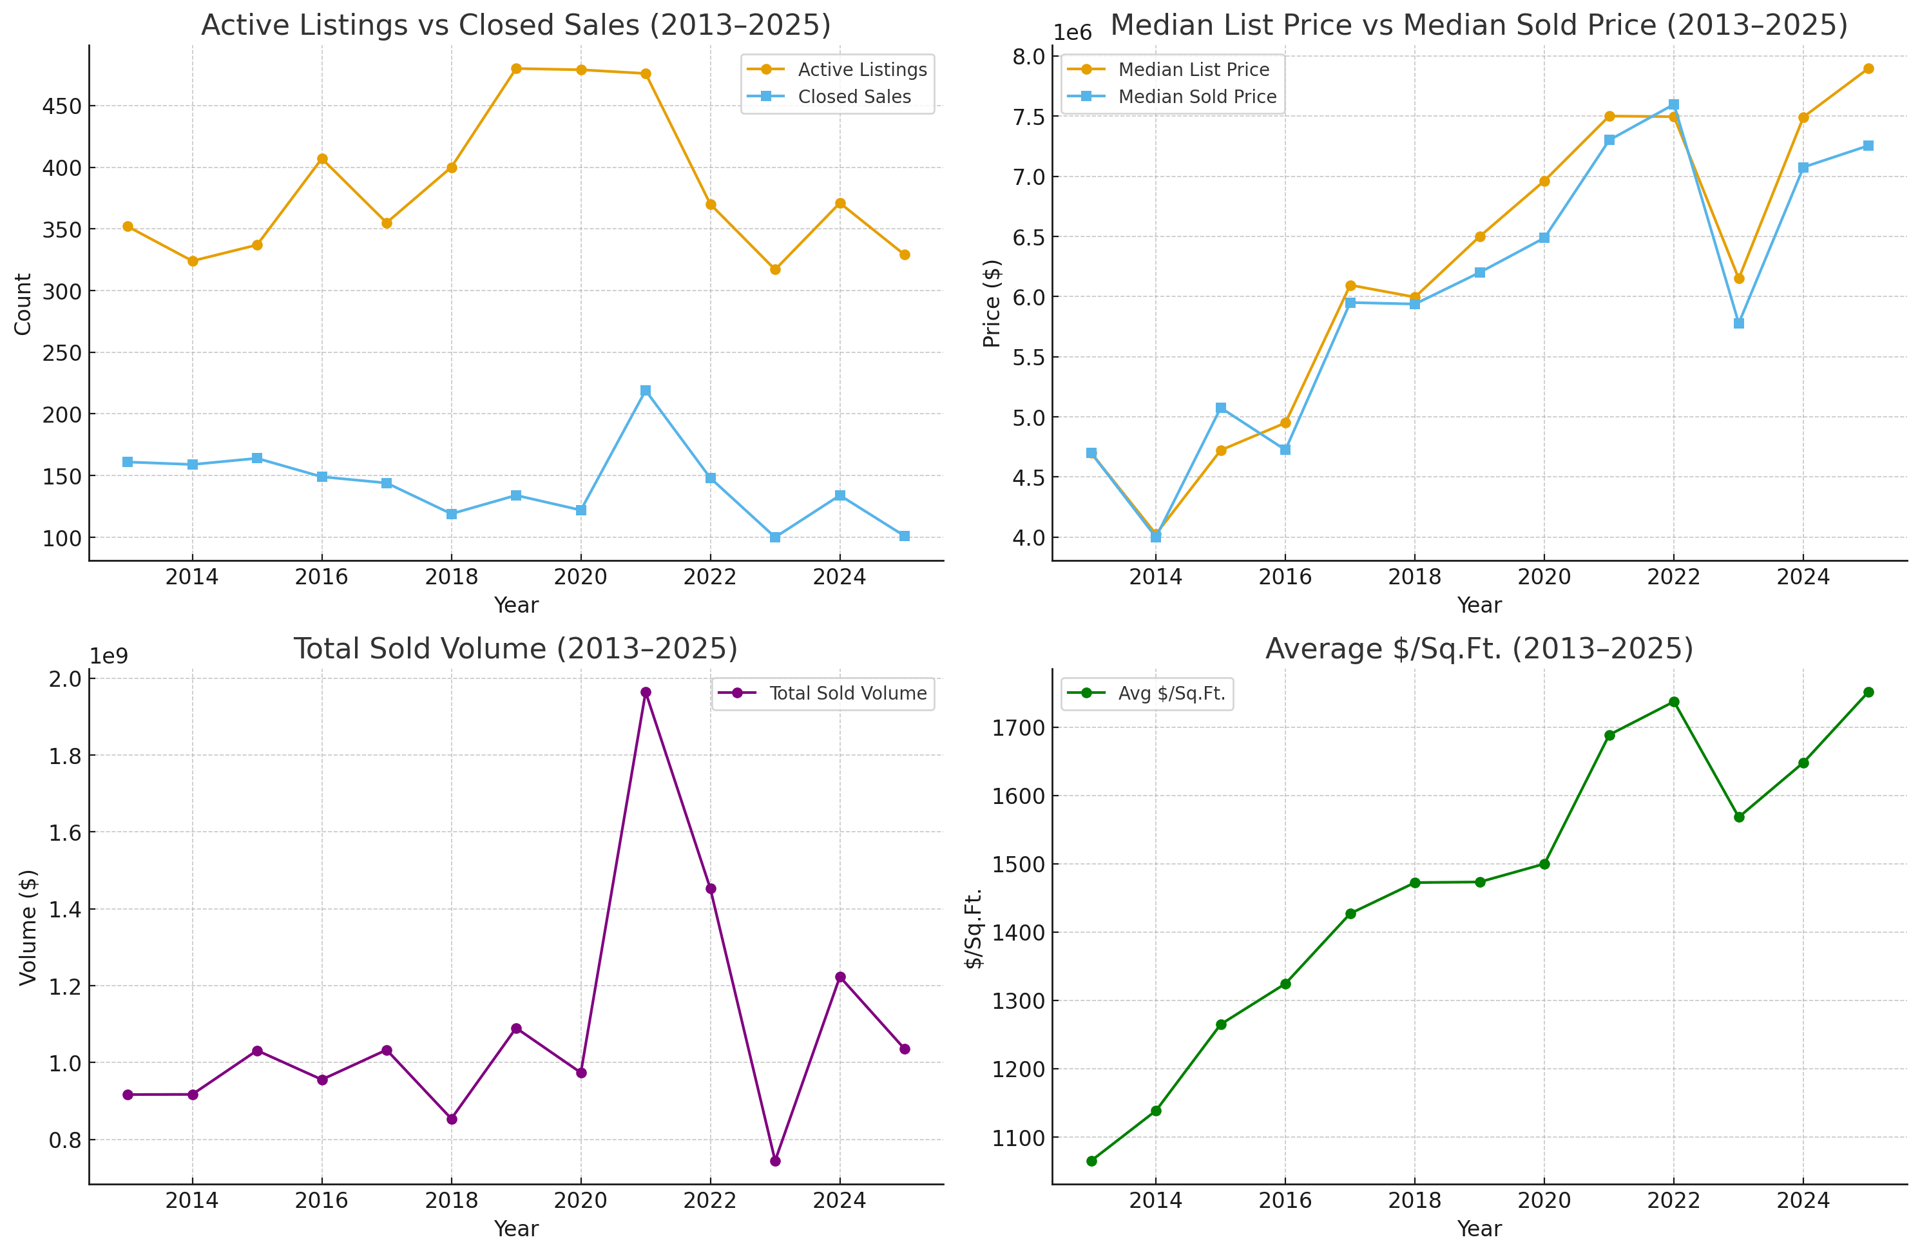
2013 |
578 |
360 |
62.3% |
$995,000.00 |
$975,000.00 |
$400,000.00 |
$5,700,000.00 |
$1,162,019.00 |
$1,150,678.00 |
59 |
$479.31 |
|
$414,244,096.00 |
|
2014 |
576 |
340 |
59.0% |
$1,195,000.00 |
$1,167,050.00 |
$495,000.00 |
$6,500,000.00 |
$1,391,378.00 |
$1,370,204.00 |
63 |
$545.20 |
|
$465,869,355.00 |
|
2015 |
657 |
352 |
53.6% |
$1,249,600.00 |
$1,278,250.00 |
$595,000.00 |
$3,995,000.00 |
$1,446,495.00 |
$1,431,630.00 |
57 |
$590.04 |
|
$503,933,684.00 |
|
2016 |
626 |
333 |
53.2% |
$1,399,000.00 |
$1,400,000.00 |
$550,000.00 |
$7,600,000.00 |
$1,626,761.00 |
$1,606,114.00 |
59 |
$611.62 |
|
$534,835,835.00 |
|
2017 |
614 |
346 |
56.4% |
$1,399,000.00 |
$1,380,500.00 |
$492,450.00 |
$4,495,000.00 |
$1,847,282.00 |
$1,590,837.00 |
56 |
$635.00 |
|
$550,429,748.00 |
|
2018 |
517 |
262 |
50.6% |
$1,499,499.00 |
$1,542,000.00 |
$515,000.00 |
$6,500,000.00 |
$1,796,761.00 |
$1,800,065.00 |
49 |
$675.71 |
|
$471,616,985.00 |
|
2019 |
506 |
249 |
49% |
$1,675,000.00 |
$1,607,770.00 |
$740,000.00 |
$6,923,750.00 |
$1,962,030.00 |
$1,918,020.00 |
56 |
$701.99 |
|
$477,586,883.00 |
|
2020 |
525 |
218 |
41.5% |
$1,824,499.00 |
$1,842,500.00 |
$840,000.00 |
$7,000,000.00 |
$2,103,796.00 |
$2,068,274.00 |
26 |
$715.39 |
|
$450,883,833.00 |
|
2021 |
532 |
332 |
62.4% |
$1,989,500.00 |
$2,050,000.00 |
$630,000.00 |
$6,700,000.00 |
$2,270,024.00 |
$2,287,159.00 |
34 |
$801.31 |
|
$759,336,721.00 |
|
2022 |
414 |
235 |
56.7% |
$2,000,000.00 |
$2,160,000.00 |
$720,000.00 |
$7,680,000.00 |
$2,502,352.00 |
$2,554,774.00 |
26 |
$918.65 |
|
$600,371,903.00 |
|
2023 |
371 |
173 |
46.6% |
$2,189,000.00 |
$2,186,000.00 |
$600,000.00 |
$7,825,000.00 |
$2,459,060.00 |
$2,427,349.00 |
32 |
$901.92 |
|
$419,931,382.00 |
|
2024 |
477 |
186 |
38.9% |
$2,099,000.00 |
$2,176,250.00 |
$842,000.00 |
$9,300,000.00 |
$2,528,829.00 |
$2,502,574.00 |
29 |
$1,010.98 |
|
$465,478,740.00 |
|
2025 |
532 |
188 |
35.3% |
$2,149,000.00 |
$2,092,000.00 |
$725,000.00 |
$12,797,500.00 |
$2,502,697.00 |
$2,452,289.00 |
37 |
$915.92 |
|
$461,030,405.00 |
Sherman Oaks
|
Year |
Active Listings |
Closed Sales |
Conversion % |
Median List Price |
Median Sold Price |
Min Price Sold |
Max Price Sold |
Avg List Price |
Avg Sold Price |
Avg Days to Sell |
Avg $/Sq.Ft. |
|
Total Sold Volume |
|
|
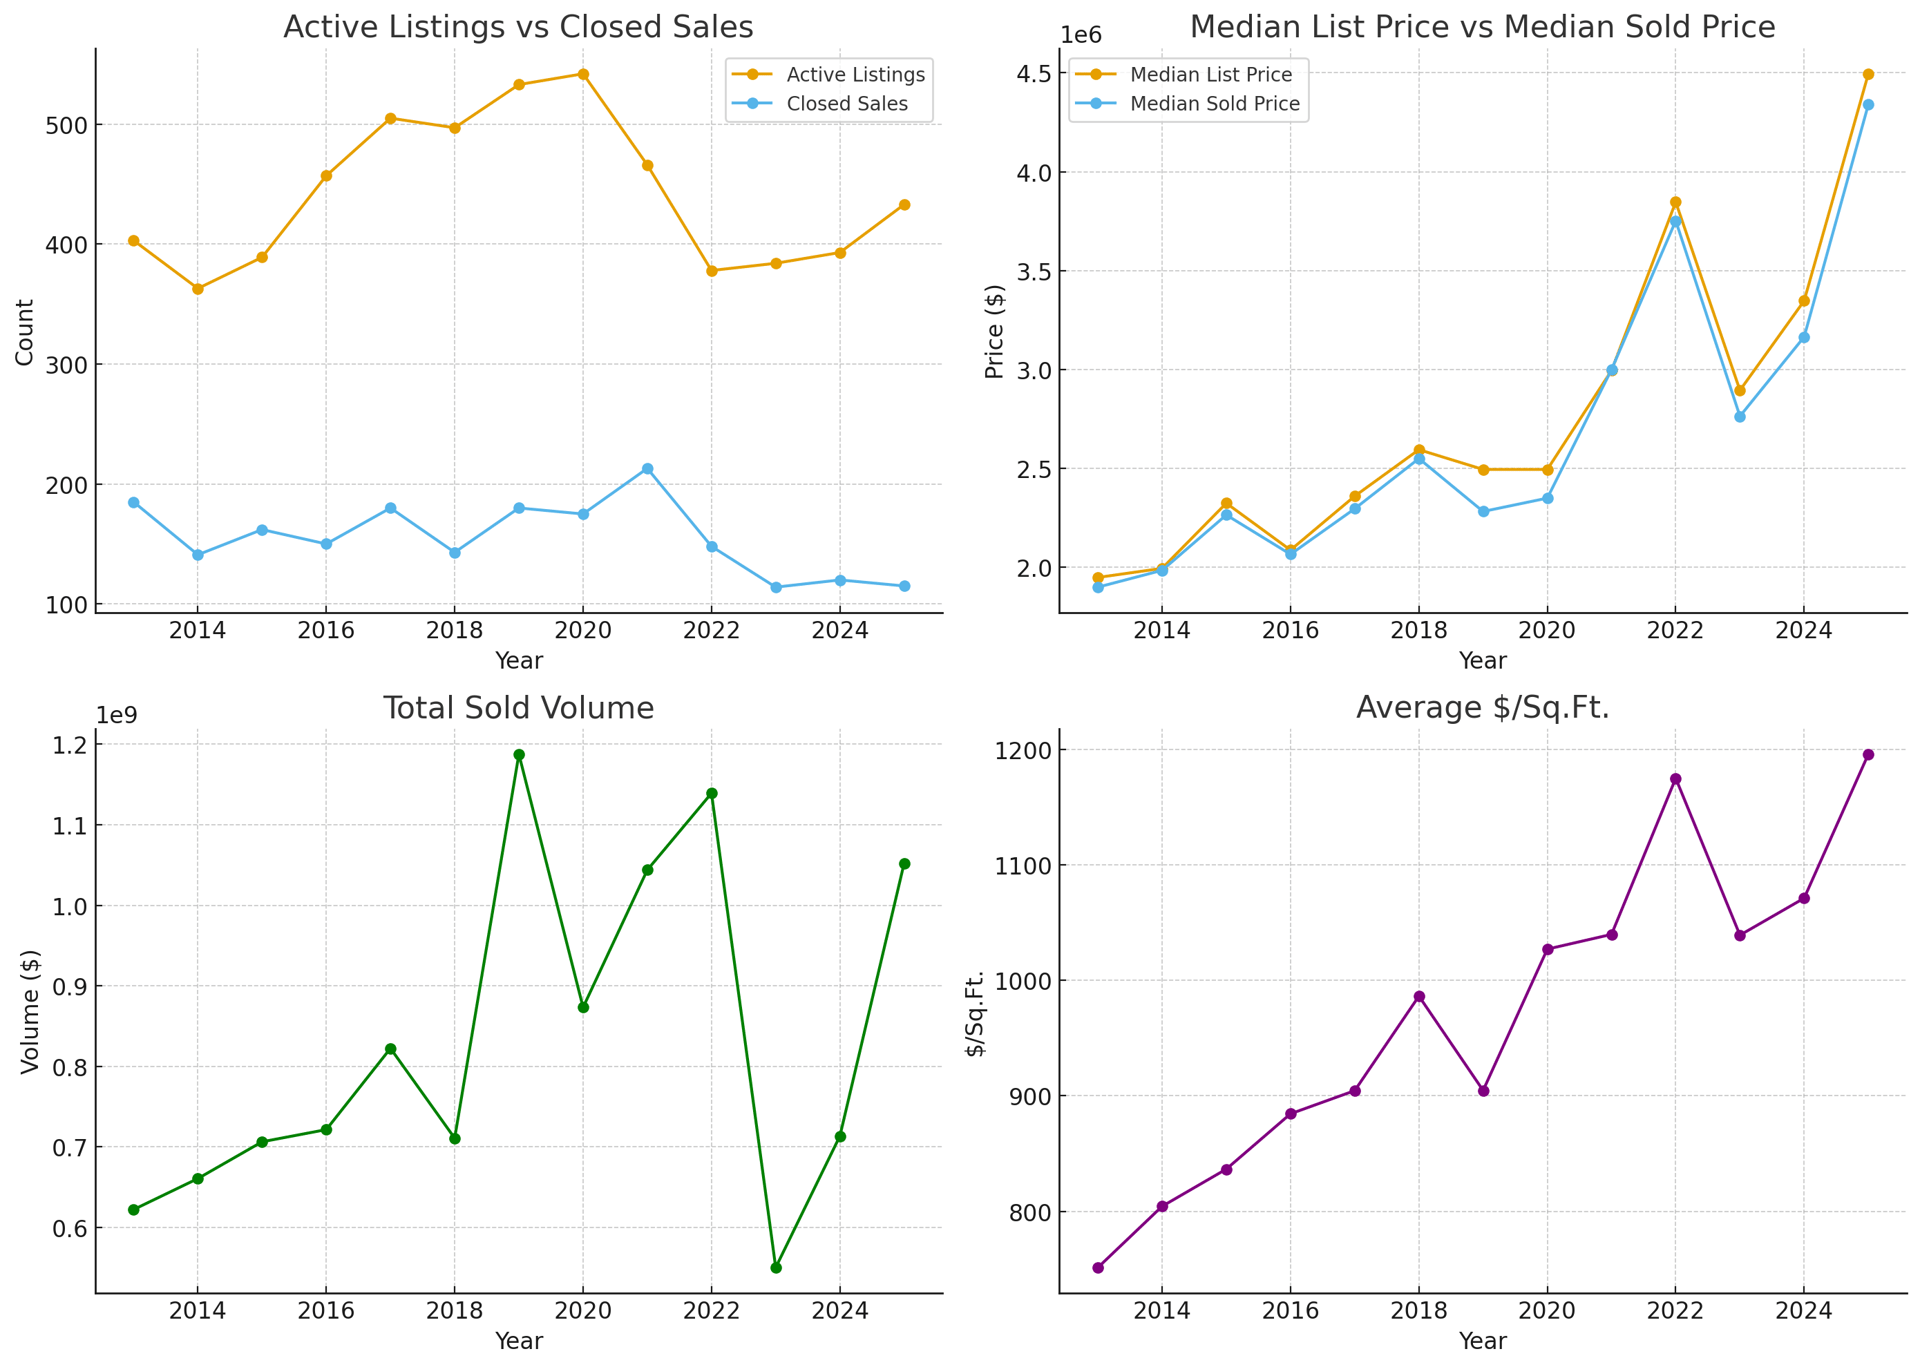
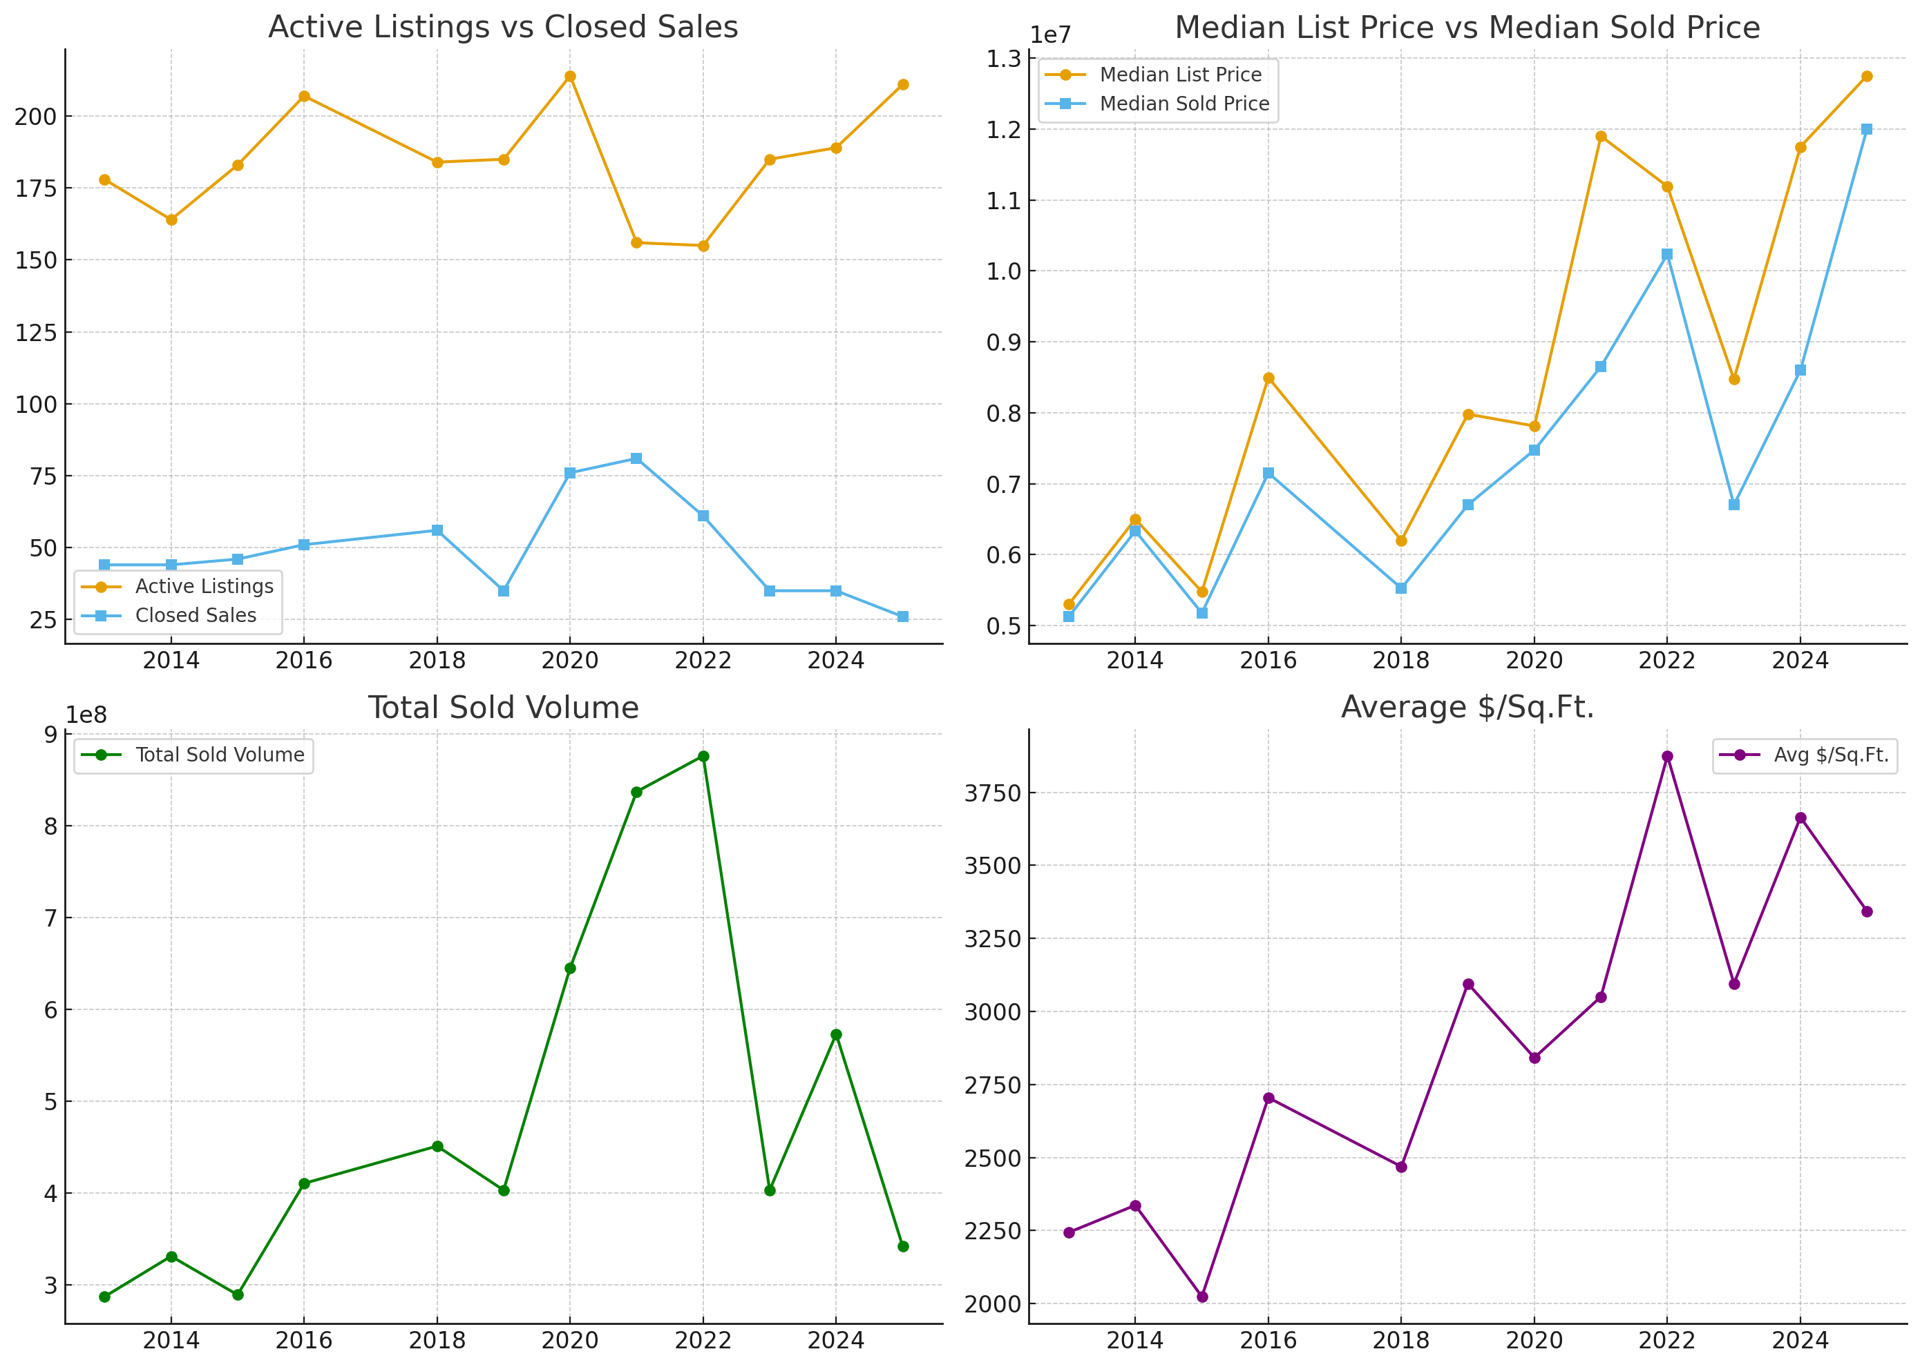
2013 |
1034 |
652 |
63.1% |
$797,628.00 |
$800,750.00 |
$272,000.00 |
$3,100,000.00 |
$923,260.00 |
$918,091.00 |
56 |
$424.86 |
|
$598,595,900.00 |
|
|
2014 |
1021 |
640 |
62.7% |
$895,000.00 |
$890,000.00 |
$376,000.00 |
$3,431,000.00 |
$1,021,117.00 |
$1,013,589.00 |
59 |
$465.38 |
|
$648,696,803.00 |
|
|
2015 |
1106 |
628 |
56.8% |
$947,875.00 |
$951,262.00 |
$445,000.00 |
$6,995,000.00 |
$1,180,887.00 |
$1,168,032.00 |
56 |
$491.90 |
|
$733,523,901.00 |
|
|
2016 |
1105 |
641 |
58.0% |
$1,175,333.00 |
$1,150,000.00 |
$525,000.00 |
$6,700,000.00 |
$1,328,655.00 |
$1,307,239.00 |
59 |
$520.14 |
|
$837,939,927.00 |
|
|
2017 |
1056 |
671 |
63.5% |
$1,156,333.00 |
$1,150,000.00 |
$405,000.00 |
$6,775,000.00 |
$1,329,010.00 |
$1,310,735.00 |
61 |
$544.76 |
|
$879,502,893.00 |
|
|
2018 |
854 |
458 |
53.6% |
$1,249,987.00 |
$1,250,000.00 |
$600,000.00 |
$7,525,000.00 |
$1,450,245.00 |
$1,442,445.00 |
49 |
$603.39 |
|
$660,639,857.00 |
|
|
2019 |
975 |
477 |
48.9% |
$1,250,000.00 |
$1,225,000.00 |
$500,000.00 |
$5,100,000.00 |
$1,411,821.00 |
$1,390,671.00 |
52 |
$595.28 |
|
$663,350,133.00 |
|
|
2020 |
862 |
439 |
50.9% |
$1,349,998.00 |
$1,353,825.00 |
$263,000.00 |
$9,500,000.00 |
$1,654,277.00 |
$1,628,487.00 |
31 |
$630.76 |
|
$714,905,948.00 |
|
|
2021 |
809 |
571 |
70.6% |
$1,499,000.00 |
$1,560,000.00 |
$732,750.00 |
$6,850,000.00 |
$1,756,259.00 |
$1,792,222.00 |
26 |
$731.16 |
|
$1,023,358,894.00 |
|
|
2022 |
675 |
439 |
65.0% |
$1,699,000.00 |
$1,850,000.00 |
$855,000.00 |
$8,500,000.00 |
$2,027,243.00 |
$2,100,165.00 |
20 |
$846.18 |
|
$921,972,461.00 |
|
|
2023 |
602 |
323 |
53.7% |
$1,693,000.00 |
$1,700,000.00 |
$700,000.00 |
$9,500,000.00 |
$1,973,350.00 |
$1,985,205.00 |
29 |
$838.86 |
|
$641,221,245.00 |
|
|
2024 |
713 |
328 |
46.0% |
$1,795,000.00 |
$1,781,000.00 |
$700,000.00 |
$15,000,000.00 |
$2,106,095.00 |
$2,094,181.00 |
31 |
$852.21 |
|
$686,891,343.00 |
|
|
2025 |
779 |
310 |
39.8% |
$1,899,499.00 |
$1,875,000.00 |
$850,000.00 |
$7,047,000.00 |
$2,157,036.00 |
$2,112,696.00 |
39 |
$827.34 |
|
$654,935,678.00 |
|
Encino
|
Year |
Active Listings |
Closed Sales |
Closure Rate |
Median List Price |
Median Sold Price |
Min Price Sold |
Max Price Sold |
Avg List Price |
Avg Sold Price |
DOM Closed |
Avg $/Sq.Ft. |
|
Total Sold Volume |
|
|
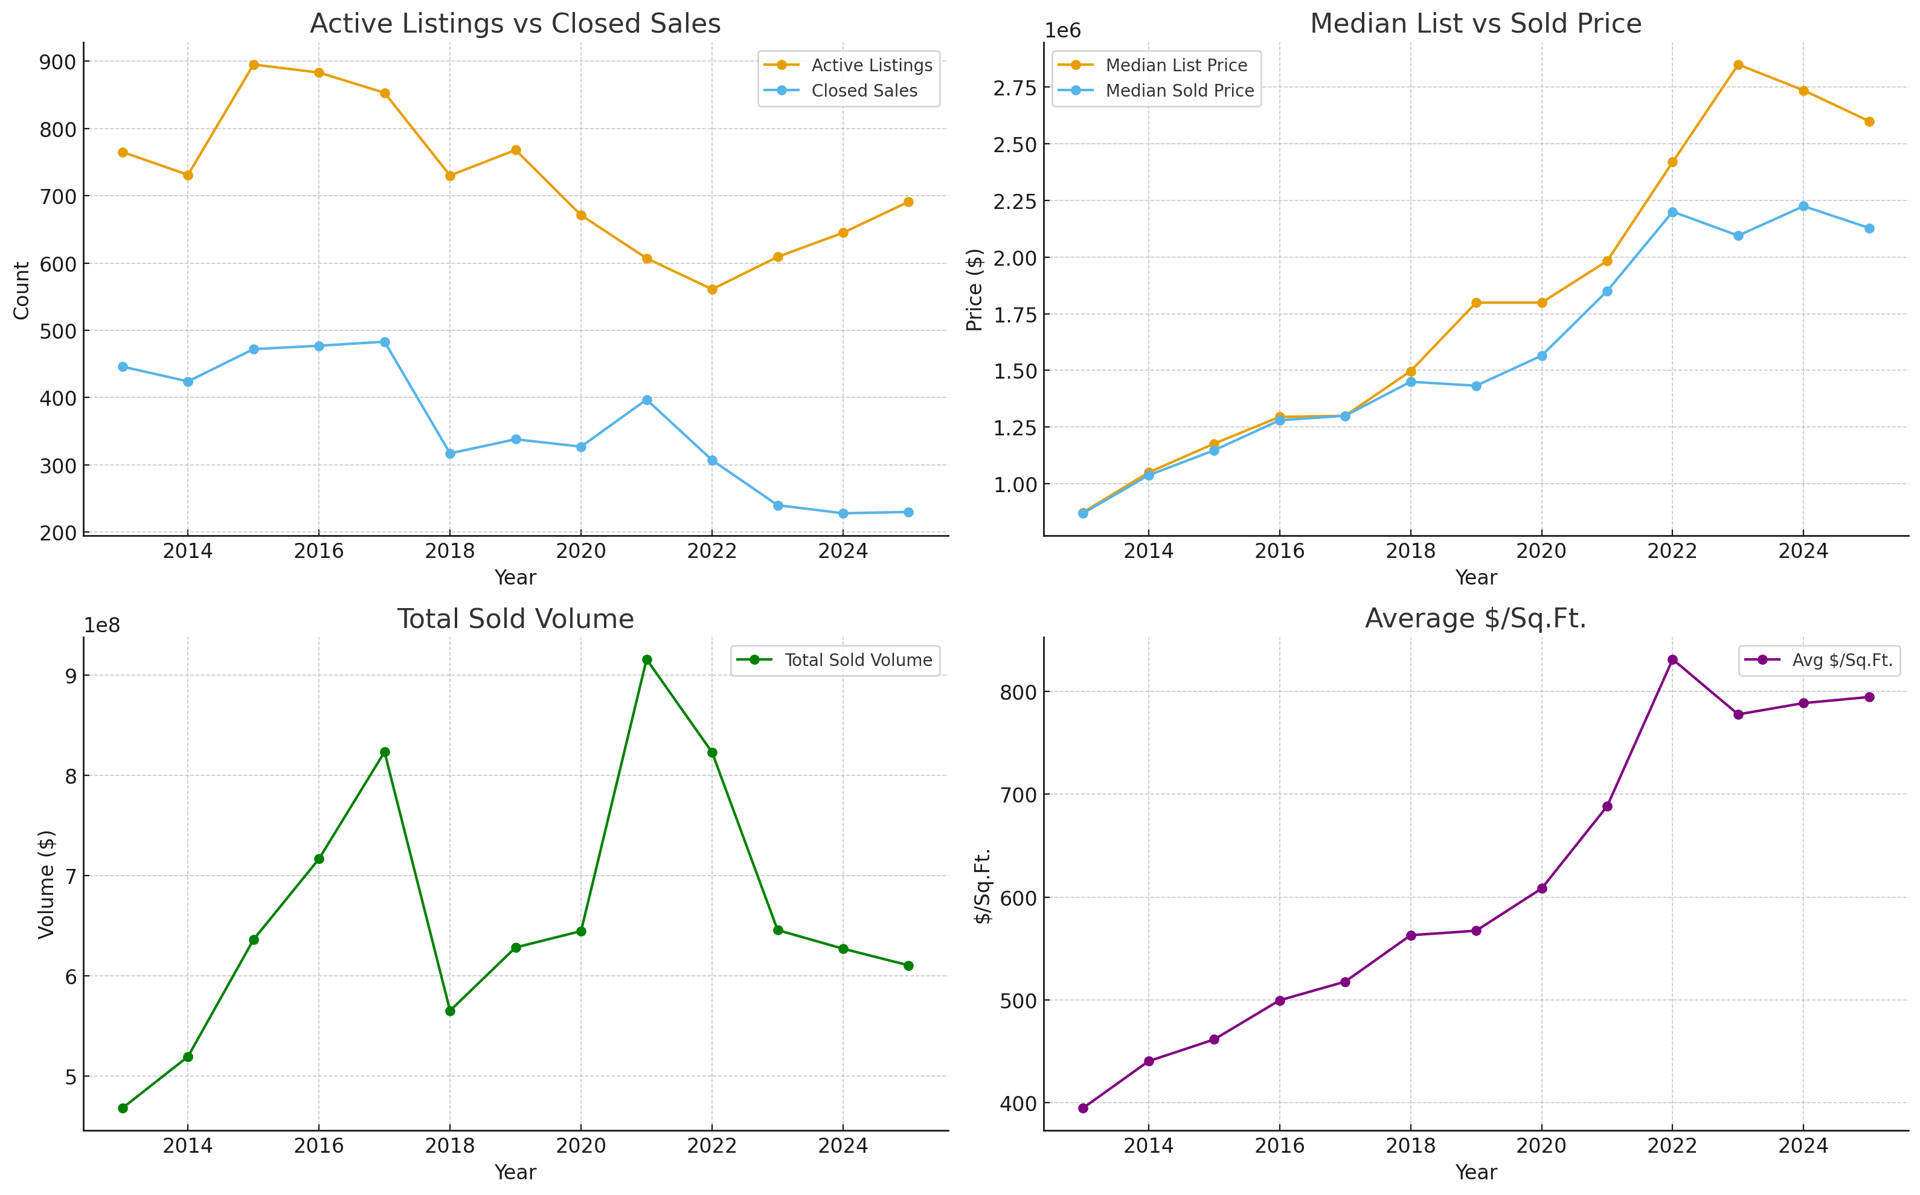
2013 |
765 |
446 |
58.3% |
$874,000.00 |
$870,000.00 |
$299,000.00 |
$5,550,000.00 |
$1,062,218.00 |
$1,048,817.00 |
58 |
$394.54 |
|
$467,772,358.00 |
|
|
2014 |
731 |
424 |
58.0% |
$1,049,995.00 |
$1,037,500.00 |
$335,000.00 |
$5,700,000.00 |
$1,244,815.00 |
$1,224,429.00 |
64 |
$440.18 |
|
$519,157,701.00 |
|
|
2015 |
895 |
472 |
52.7% |
$1,176,975.00 |
$1,147,500.00 |
$405,000.00 |
$6,300,000.00 |
$1,383,900.00 |
$1,347,448.00 |
61 |
$461.30 |
|
$635,995,453.00 |
|
|
2016 |
883 |
477 |
54.0% |
$1,295,000.00 |
$1,280,000.00 |
$485,000.00 |
$7,950,000.00 |
$1,538,286.00 |
$1,502,357.00 |
66 |
$499.45 |
|
$716,624,188.00 |
|
|
2017 |
853 |
483 |
56.6% |
$1,299,868.00 |
$1,300,000.00 |
$150,000.00 |
$8,253,000.00 |
$1,745,974.00 |
$1,704,640.00 |
60 |
$517.56 |
|
$823,341,268.00 |
|
|
2018 |
730 |
317 |
43.4% |
$1,497,000.00 |
$1,450,000.00 |
$530,000.00 |
$10,650,000.00 |
$1,824,685.00 |
$1,782297 |
57 |
$562.82 |
|
$564,988,095.00 |
|
|
2019 |
768 |
338 |
44.0% |
$1,799,000.00 |
$1,432,500.00 |
$515,000.00 |
$10,800,000.00 |
$2,231,834.00 |
$1,858,363.00 |
57 |
$567.20 |
|
$628,126,649.00 |
|
|
2020 |
671 |
327 |
48.7% |
$1,799,000.00 |
$1,565,000.00 |
$280,000.00 |
$17,495,000.00 |
$2,443,016.00 |
$1,970,917.00 |
35 |
$608.30 |
|
$644,489,804.00 |
|
|
2021 |
607 |
397 |
65.4% |
$1,982,500.00 |
$1,850,000.00 |
$650,000.00 |
$15,200,000.00 |
$3,351,874.00 |
$2,306,938.00 |
27 |
$688.39 |
|
$915,854,532.00 |
|
|
2022 |
561 |
307 |
54.7% |
$2,419,000.00 |
$2,200,000.00 |
$755,000.00 |
$16,000,000.00 |
$3,366,447.00 |
$2,680,603.00 |
24 |
$831.45 |
|
$822,945,001.00 |
|
|
2023 |
609 |
240 |
39.4% |
$2,849,000.00 |
$2,094,500.00 |
$740,000.00 |
$17,500,000.00 |
$3,664,362.00 |
$2,689,347.00 |
36 |
$777.82 |
|
$645,443,298.00 |
|
|
2024 |
645 |
228 |
35.3% |
$2,735,000.00 |
$2,224,425.00 |
$470,000.00 |
$17,125,000.00 |
$3,596,948.00 |
$2,749,474.00 |
37 |
$788.83 |
|
$626,880,001.00 |
|
|
2025 |
691 |
230 |
33.3% |
$2,599,000.00 |
$2,128,000.00 |
$650,000.00 |
$15,250,000.00 |
$3,704,171.00 |
$2,653,384.00 |
42 |
$794.73 |
|
$610,278,822.00 |
|